Analysis

43 - Allegheny Go Program Growth

Coverage: 2019-01 to 2025-11 (from otp_monthly).

Built 2026-06-15 11:52 UTC · Commit e5cf673

Page Navigation

Analysis Navigation

Data Provenance

flowchart LR
  43_allegheny_go_growth(["43 - Allegheny Go Program Growth"])
  f1_43_allegheny_go_growth[/"data/allegheny-go/enrollments_weekly.csv"/] --> 43_allegheny_go_growth
  t_otp_monthly[("otp_monthly")] --> 43_allegheny_go_growth
  01_data_ingestion[["Data Ingestion"]] --> t_otp_monthly
  u1_01_data_ingestion[/"data/routes_by_month.csv"/] --> 01_data_ingestion
  u2_01_data_ingestion[/"data/PRT_Current_Routes_Full_System_de0e48fcbed24ebc8b0d933e47b56682.csv"/] --> 01_data_ingestion
  u3_01_data_ingestion[/"data/Transit_stops_(current)_by_route_e040ee029227468ebf9d217402a82fa9.csv"/] --> 01_data_ingestion
  u4_01_data_ingestion[/"data/PRT_Stop_Reference_Lookup_Table.csv"/] --> 01_data_ingestion
  u5_01_data_ingestion[/"data/average-ridership/12bb84ed-397e-435c-8d1b-8ce543108698.csv"/] --> 01_data_ingestion
  t_allegheny_go_weekly[("allegheny_go_weekly")] --> 43_allegheny_go_growth
  d1_43_allegheny_go_growth(("polars (lib)")) --> 43_allegheny_go_growth
  d2_43_allegheny_go_growth(("scipy (lib)")) --> 43_allegheny_go_growth
  classDef page fill:#dbeafe,stroke:#1d4ed8,color:#1e3a8a,stroke-width:2px;
  classDef table fill:#ecfeff,stroke:#0e7490,color:#164e63;
  classDef dep fill:#fff7ed,stroke:#c2410c,color:#7c2d12,stroke-dasharray: 4 2;
  classDef file fill:#eef2ff,stroke:#6366f1,color:#3730a3;
  classDef api fill:#f0fdf4,stroke:#16a34a,color:#14532d;
  classDef pipeline fill:#f5f3ff,stroke:#7c3aed,color:#4c1d95;
  class 43_allegheny_go_growth page;
  class t_allegheny_go_weekly,t_otp_monthly table;
  class d1_43_allegheny_go_growth,d2_43_allegheny_go_growth dep;
  class f1_43_allegheny_go_growth,u1_01_data_ingestion,u2_01_data_ingestion,u3_01_data_ingestion,u4_01_data_ingestion,u5_01_data_ingestion file;
  class 01_data_ingestion pipeline;

Findings

Findings: Allegheny Go Program Growth

Summary

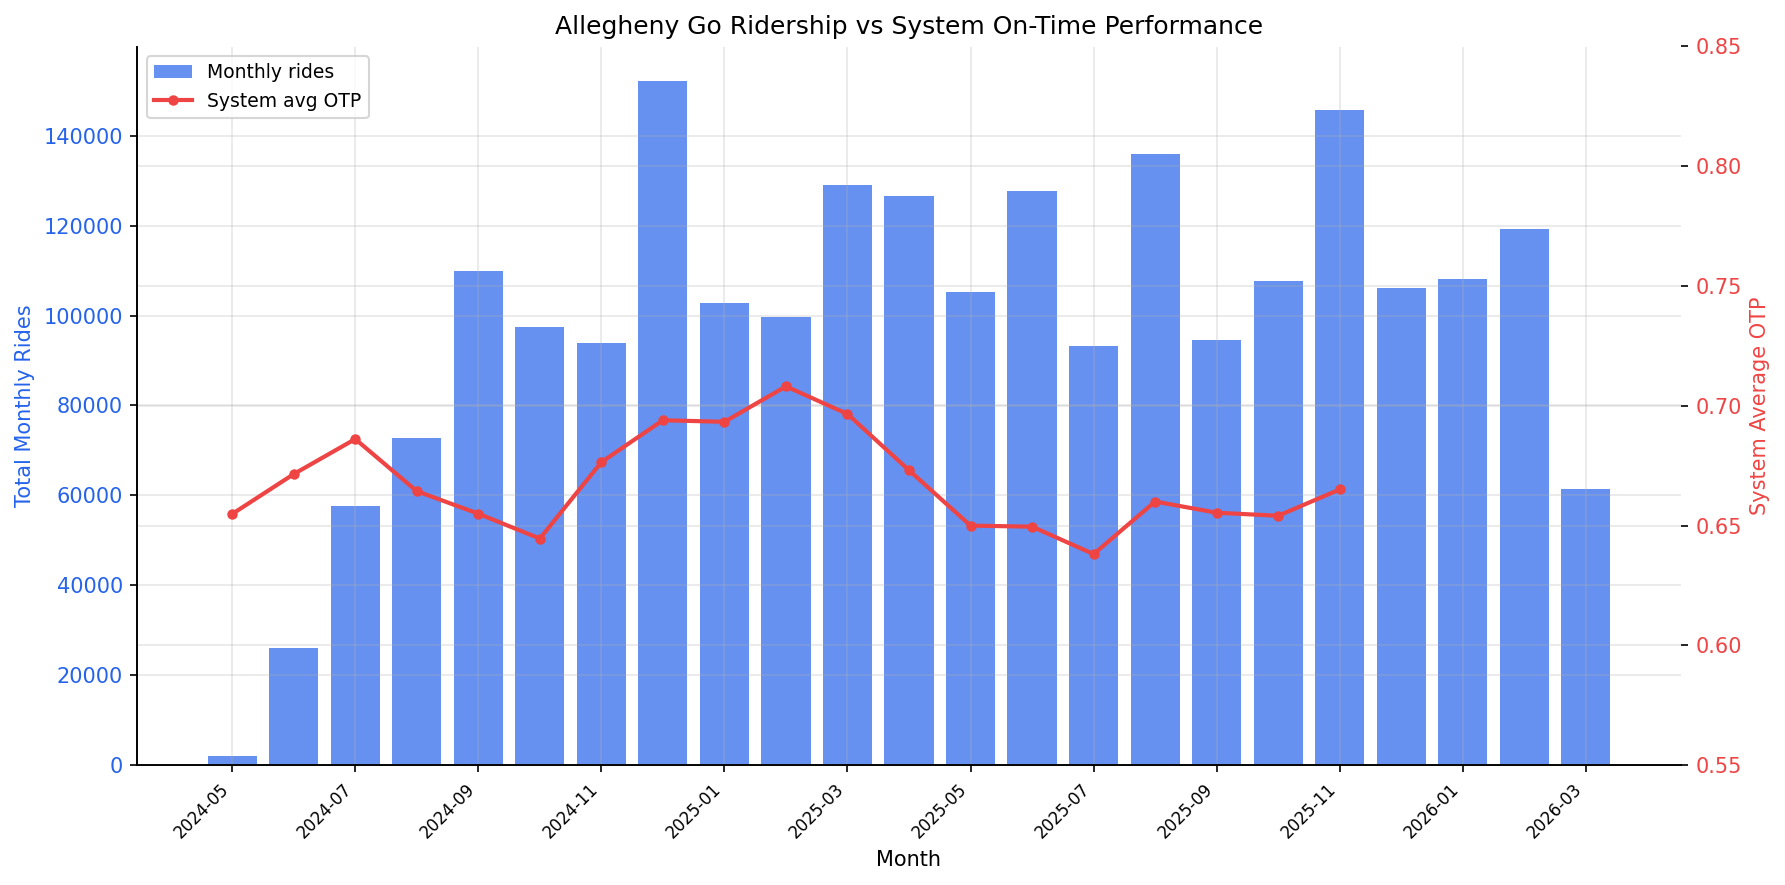
The Allegheny Go program grew rapidly from 262 rides in its first week (May 2024) to over 30,000 rides per week by late 2025, with 2.27 million total rides to date. Program ridership does not correlate with system-level OTP (Pearson r = 0.129, p = 0.600, n = 19 months), suggesting the program's growth is driven by enrollment expansion rather than service quality fluctuations.

Key Numbers

  • 2,274,373 total rides across 96 weeks (May 2024 – March 2026)
  • Peak monthly riders: ~3,375 unique riders
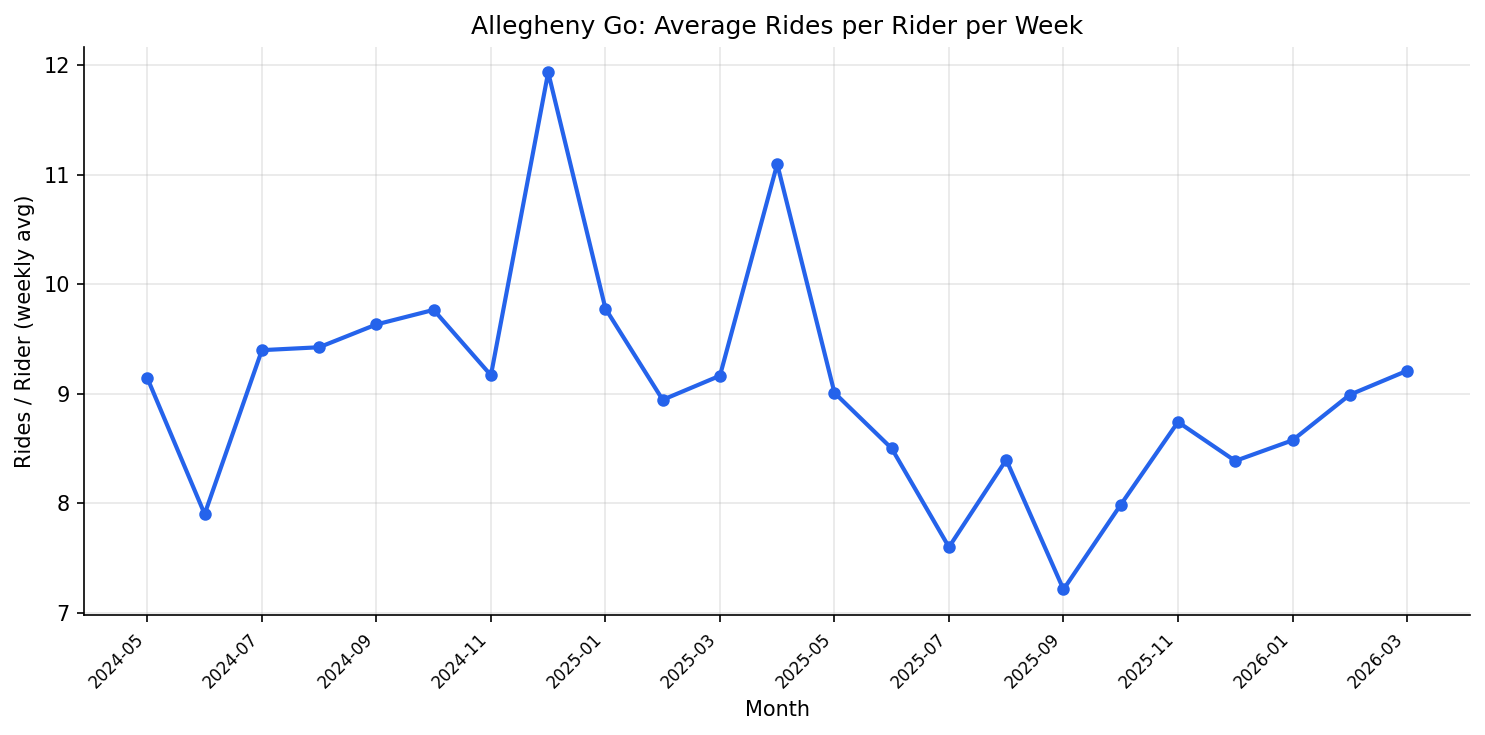
  • Rides per rider per week: 8–12, averaging ~9.5 (consistent utilization)
  • Pearson r (monthly rides vs system OTP): 0.129 (p = 0.600, n = 19)
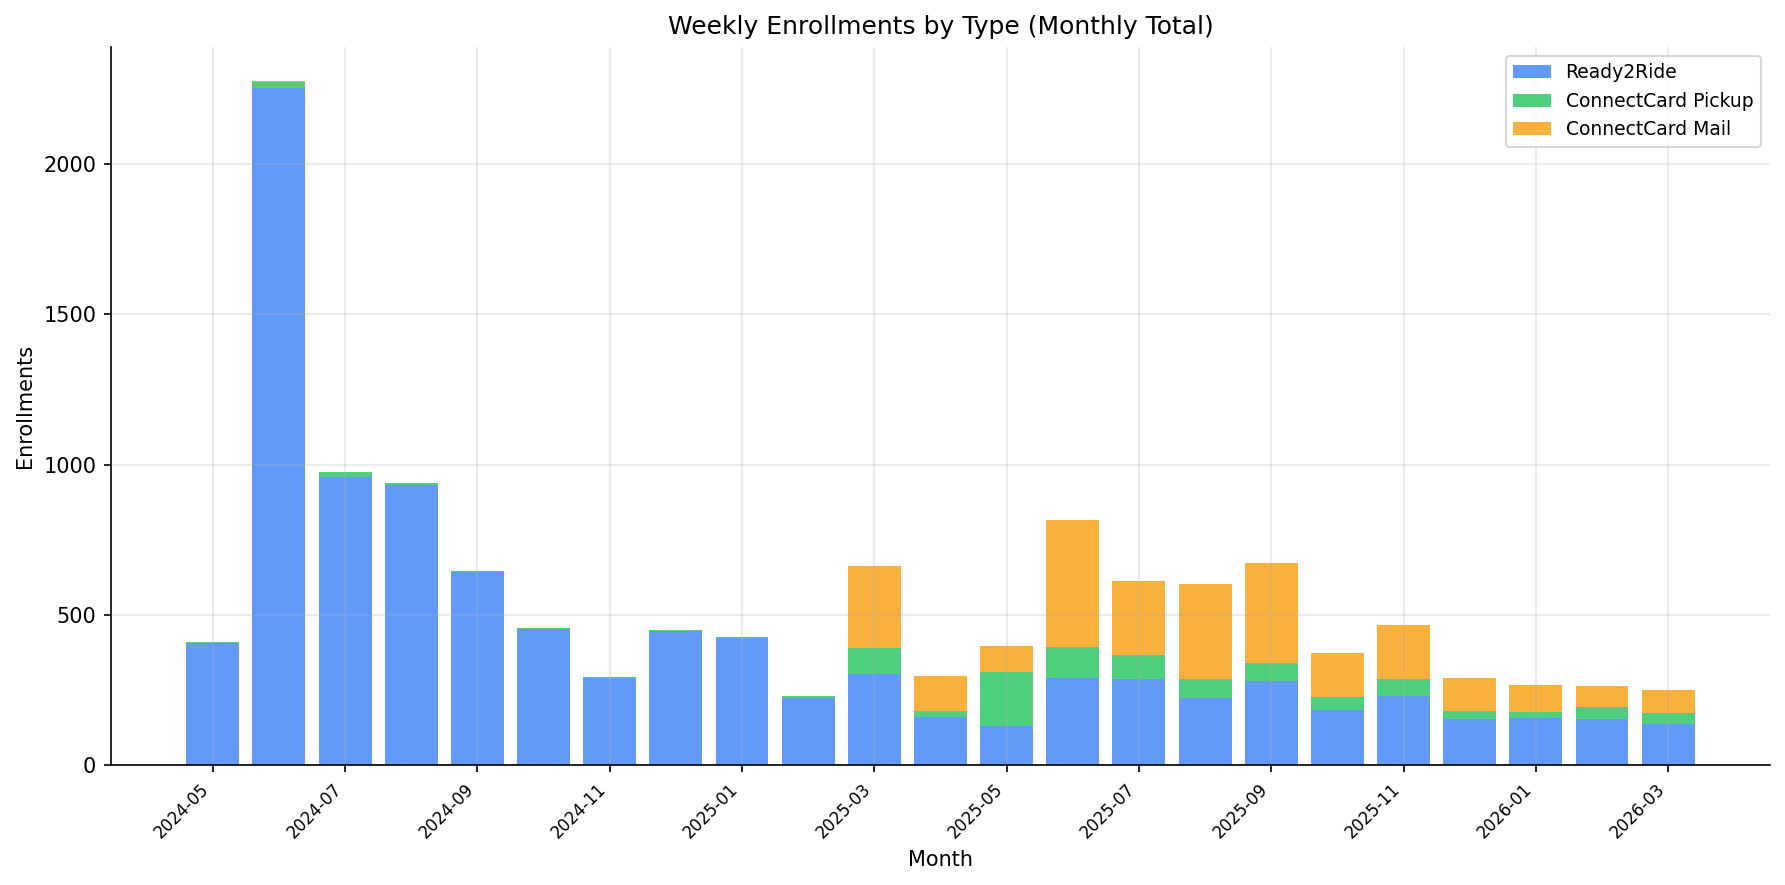
  • Ready2Ride dominated early enrollment (2,300 in June 2024 launch month); ConnectCard Mail surged starting March 2025

Observations

  • Rapid S-curve growth. The program went from near-zero to ~100K monthly rides in five months (May–October 2024), then plateaued at 100K–130K monthly rides. The December 2024 spike to 152K rides appears to be a 5-week month effect.
  • Utilization is stable. Rides per rider per week hovers between 8 and 12 across the full period, suggesting participants use the program consistently once enrolled. No sign of "churning" (enrolling but not riding).
  • Enrollment shifted from Ready2Ride to ConnectCard. The launch was Ready2Ride-dominated (digital-first). ConnectCard Mail enrollments appeared in March 2025 and now represent the largest enrollment channel, suggesting the program expanded to less digitally-connected populations.
  • No OTP correlation. System OTP fluctuates between 0.64 and 0.71 during the program period, but these fluctuations are uncorrelated with ridership growth. The program's trajectory is a monotonic ramp-up regardless of service quality.

Caveats

  • Only 19 months of overlap between Allegheny Go ridership and OTP data limits statistical power for the correlation test.
  • Weekly-to-monthly conversion assigns each week to its week_start month; weeks spanning month boundaries are attributed to the earlier month.
  • System OTP is an unweighted average across all routes. Allegheny Go riders likely concentrate on a subset of routes, so route-specific OTP would be more informative (but route-level program data is not available).
  • The December 2024 spike is likely a calendar artifact (5 weeks in that month), not a genuine ridership increase.

Validation

  1. Data source verified. Ridership from allegheny_go_weekly table (pipeline 08); OTP from otp_monthly table.
  2. Temporal scope matches. Both datasets filtered to their natural ranges; overlap period (May 2024 – Nov 2025) explicitly identified.
  3. Null handling. System OTP is null for months outside OTP coverage; these months are excluded from correlation but included in growth charts.
  4. Aggregates sanity-checked. Total rides (2.27M) matches the dashboard KPI (2.26M); small difference due to rounding.
  5. Direction of effects checked. Rising ridership with flat OTP is expected for a new enrollment-driven program; a strong correlation would have been surprising and warranted investigation.

Output
Methods

Methods: Allegheny Go Program Growth

Question

How has the Allegheny Go fare program grown since its May 2024 launch, and does its ridership growth track with or diverge from system-level on-time performance?

Approach

  1. Load weekly ridership from the allegheny_go_weekly database table and convert to monthly totals by assigning each week to its calendar month.
  2. Compute monthly system-average OTP from otp_monthly.
  3. Load weekly enrollments from CSV, convert to monthly.
  4. Overlay monthly rides on system OTP using a dual-axis chart for the overlap period (May 2024 through November 2025).
  5. Track rides-per-rider as a utilization metric over time.
  6. Build an enrollment-by-type stacked area chart.

Data

Name Description Source
allegheny_go_weekly Weekly rides and unique riders prt.db table
enrollments_weekly.csv Weekly enrollments by type data/allegheny-go/
otp_monthly Monthly OTP per route prt.db table

Output

  • growth_vs_otp.csv — monthly Allegheny Go metrics alongside system OTP
  • ridership_otp_overlay.png — dual-axis chart of program ridership and system OTP
  • enrollment_by_type.png — stacked area of enrollment types over time
  • utilization_trend.png — rides-per-rider utilization over time

Source Code

"""Analysis 43: track Allegheny Go program growth and overlay on system OTP."""

import polars as pl
from scipy import stats

from prt_otp_analysis.common import (
    COLOR_PRIMARY,
    DATA_DIR,
    analysis_dir,
    phase,
    query_to_polars,
    run_analysis,
    save_chart,
    save_csv,
    setup_plotting,
)

OUT = analysis_dir(__file__)
AG_DIR = DATA_DIR / "allegheny-go"

ENROLLMENT_COLORS: dict[str, str] = {
    "Ready2Ride": "#3b82f6",
    "ConnectCard Pickup": "#22c55e",
    "ConnectCard Mail": "#f59e0b",
}


def load_ridership_monthly() -> pl.DataFrame:
    """Load weekly ridership from DB and aggregate to monthly."""
    weekly_df = query_to_polars(
        "SELECT week_start, rides, riders FROM allegheny_go_weekly ORDER BY week_start"
    )
    return (
        weekly_df.with_columns(
            month=pl.col("week_start").str.slice(0, 7),
        )
        .group_by("month")
        .agg(
            total_rides=pl.col("rides").sum(),
            avg_weekly_riders=pl.col("riders").mean(),
            max_riders=pl.col("riders").max(),
            n_weeks=pl.len(),
        )
        .sort("month")
    )


def load_system_otp() -> pl.DataFrame:
    """Compute unweighted system-average OTP per month."""
    return query_to_polars("""
        SELECT month, AVG(otp) AS system_otp, COUNT(*) AS n_routes
        FROM otp_monthly
        GROUP BY month
        ORDER BY month
    """)


def load_enrollments_monthly() -> pl.DataFrame:
    """Load weekly enrollments and aggregate to monthly by type."""
    enroll_df = pl.read_csv(AG_DIR / "enrollments_weekly.csv")
    return (
        enroll_df.with_columns(
            month=pl.col("week_start").str.slice(0, 7),
        )
        .group_by("month", "enrollment_type")
        .agg(total=pl.col("count").sum())
        .sort("month", "enrollment_type")
    )


def make_ridership_otp_overlay(monthly_df: pl.DataFrame) -> None:
    """Dual-axis chart: monthly rides (bars) and system OTP (line)."""
    plt = setup_plotting()
    fig, ax1 = plt.subplots(figsize=(12, 6))

    months = monthly_df["month"].to_list()
    rides = monthly_df["total_rides"].to_list()
    otp = monthly_df["system_otp"].to_list()
    x = range(len(months))

    # Rides as bars (left axis)
    ax1.bar(x, rides, color=COLOR_PRIMARY, alpha=0.7, label="Monthly rides")
    ax1.set_ylabel("Total Monthly Rides", color=COLOR_PRIMARY)
    ax1.tick_params(axis="y", labelcolor=COLOR_PRIMARY)
    ax1.set_xticks(list(x)[::2])
    ax1.set_xticklabels([months[i] for i in list(x)[::2]], rotation=45, ha="right", fontsize=8)

    # OTP as line (right axis)
    ax2 = ax1.twinx()
    valid_otp = [(i, v) for i, v in zip(x, otp) if v is not None]
    if valid_otp:
        ax2.plot(
            [i for i, _ in valid_otp],
            [v for _, v in valid_otp],
            color="#ef4444", linewidth=2, marker="o", markersize=4,
            label="System avg OTP",
        )
    ax2.set_ylabel("System Average OTP", color="#ef4444")
    ax2.tick_params(axis="y", labelcolor="#ef4444")
    ax2.set_ylim(0.55, 0.85)

    ax1.set_title("Allegheny Go Ridership vs System On-Time Performance")
    ax1.set_xlabel("Month")

    # Combined legend
    lines1, labels1 = ax1.get_legend_handles_labels()
    lines2, labels2 = ax2.get_legend_handles_labels()
    ax1.legend(lines1 + lines2, labels1 + labels2, loc="upper left", fontsize=9)

    fig.tight_layout()
    save_chart(fig, OUT / "ridership_otp_overlay.png")


def make_enrollment_chart(enroll_monthly_df: pl.DataFrame) -> None:
    """Stacked area chart of enrollment types over time."""
    plt = setup_plotting()

    pivoted_df = enroll_monthly_df.pivot(
        on="enrollment_type", index="month", values="total"
    ).sort("month").fill_null(0)

    months = pivoted_df["month"].to_list()
    x = range(len(months))

    fig, ax = plt.subplots(figsize=(12, 6))

    bottom = [0] * len(months)
    for etype, color in ENROLLMENT_COLORS.items():
        if etype in pivoted_df.columns:
            vals = pivoted_df[etype].to_list()
            ax.bar(x, vals, bottom=bottom, color=color, label=etype, alpha=0.8)
            bottom = [b + v for b, v in zip(bottom, vals)]

    ax.set_xticks(list(x)[::2])
    ax.set_xticklabels([months[i] for i in list(x)[::2]], rotation=45, ha="right", fontsize=8)
    ax.set_title("Weekly Enrollments by Type (Monthly Total)")
    ax.set_xlabel("Month")
    ax.set_ylabel("Enrollments")
    ax.legend(fontsize=9)
    fig.tight_layout()
    save_chart(fig, OUT / "enrollment_by_type.png")


def make_utilization_chart(monthly_df: pl.DataFrame) -> None:
    """Rides-per-rider utilization over time."""
    plt = setup_plotting()
    fig, ax = plt.subplots(figsize=(10, 5))

    months = monthly_df["month"].to_list()
    util = monthly_df["rides_per_rider"].to_list()

    ax.plot(range(len(months)), util, color=COLOR_PRIMARY, linewidth=2, marker="o", markersize=5)
    ax.set_xticks(range(0, len(months), 2))
    ax.set_xticklabels([months[i] for i in range(0, len(months), 2)], rotation=45, ha="right", fontsize=8)
    ax.set_title("Allegheny Go: Average Rides per Rider per Week")
    ax.set_xlabel("Month")
    ax.set_ylabel("Rides / Rider (weekly avg)")
    fig.tight_layout()
    save_chart(fig, OUT / "utilization_trend.png")


@run_analysis(43, "Allegheny Go Program Growth")
def main() -> None:
    """Entry point: analyze Allegheny Go growth and overlay on system OTP."""
    with phase("Loading data"):
        ride_monthly_df = load_ridership_monthly()
        otp_monthly_df = load_system_otp()
        enroll_monthly_df = load_enrollments_monthly()
        print(f"  Ridership months: {len(ride_monthly_df)}")
        print(f"  OTP months: {len(otp_monthly_df)}")
        print(f"  Enrollment rows: {len(enroll_monthly_df)}")

    with phase("Computing metrics"):
        # Add rides-per-rider
        ride_monthly_df = ride_monthly_df.with_columns(
            rides_per_rider=(
                pl.col("total_rides") / pl.col("avg_weekly_riders") / pl.col("n_weeks")
            ),
        )

        # Join ridership to system OTP
        merged_df = ride_monthly_df.join(otp_monthly_df, on="month", how="left")

        # Overlap period stats
        overlap_df = merged_df.filter(pl.col("system_otp").is_not_null())
        print(f"  Overlap months: {len(overlap_df)}")

        if len(overlap_df) >= 5:
            r, p = stats.pearsonr(
                overlap_df["total_rides"].to_list(),
                overlap_df["system_otp"].to_list(),
            )
            print(f"  Pearson r (rides vs OTP): {r:.3f} (p = {p:.3f}, n = {len(overlap_df)})")
        else:
            r, p = None, None
            print("  Insufficient overlap for correlation")

        # Summary stats
        total_rides = ride_monthly_df["total_rides"].sum()
        latest_riders = ride_monthly_df.sort("month").tail(1)["max_riders"][0]
        print(f"  Total rides: {total_rides:,}")
        print(f"  Latest month max riders: {latest_riders:,}")

        save_csv(
            merged_df.select(
                "month", "total_rides", "max_riders", "rides_per_rider",
                "n_weeks", "system_otp",
            ),
            OUT / "growth_vs_otp.csv",
        )

    with phase("Generating charts"):
        make_ridership_otp_overlay(merged_df)
        make_enrollment_chart(enroll_monthly_df)
        make_utilization_chart(ride_monthly_df)


if __name__ == "__main__":
    main()

Sources

NameTypeWhy It MattersOwnerFreshnessCaveat
data/allegheny-go/enrollments_weekly.csv file Weekly Allegheny Go enrollment counts by enrollment type. Local project data owner not specified. Snapshot file; refresh by rerunning its pipeline step. May lag upstream source updates.
otp_monthly table Primary analytical table used in this page's computations. Produced by Data Ingestion. Updated when the producing pipeline step is rerun. Coverage depends on upstream source availability and ETL assumptions.
Upstream sources (5)
  • file data/routes_by_month.csv — Monthly route OTP source table in wide format.
  • file data/PRT_Current_Routes_Full_System_de0e48fcbed24ebc8b0d933e47b56682.csv — Current route metadata and mode classifications.
  • file data/Transit_stops_(current)_by_route_e040ee029227468ebf9d217402a82fa9.csv — Current stop-to-route coverage and trip counts.
  • file data/PRT_Stop_Reference_Lookup_Table.csv — Historical stop reference file with geography attributes.
  • file data/average-ridership/12bb84ed-397e-435c-8d1b-8ce543108698.csv — Average ridership by route and month.
allegheny_go_weekly table Primary analytical table used in this page's computations. Project pipeline owner not linked. Refresh cadence unknown. Coverage depends on upstream source availability and ETL assumptions.
polars dependency Runtime dependency required for this page's pipeline or analysis code. Open-source Python ecosystem maintainers. Version pinned by project environment until dependency updates are applied. Library updates may change behavior or defaults.
scipy dependency Runtime dependency required for this page's pipeline or analysis code. Open-source Python ecosystem maintainers. Version pinned by project environment until dependency updates are applied. Library updates may change behavior or defaults.