Analysis

42 - Allegheny Go Equity

Coverage: 2019-01 to 2025-11 (from otp_monthly).

Built 2026-06-15 11:52 UTC · Commit e5cf673

Page Navigation

Analysis Navigation

Data Provenance

flowchart LR
  42_allegheny_go_equity(["42 - Allegheny Go Equity"])
  f1_42_allegheny_go_equity[/"data/allegheny-go/tract_reach.csv"/] --> 42_allegheny_go_equity
  f2_42_allegheny_go_equity[/"data/allegheny-go/demographics_summary.csv"/] --> 42_allegheny_go_equity
  t_otp_monthly[("otp_monthly")] --> 42_allegheny_go_equity
  01_data_ingestion[["Data Ingestion"]] --> t_otp_monthly
  u1_01_data_ingestion[/"data/routes_by_month.csv"/] --> 01_data_ingestion
  u2_01_data_ingestion[/"data/PRT_Current_Routes_Full_System_de0e48fcbed24ebc8b0d933e47b56682.csv"/] --> 01_data_ingestion
  u3_01_data_ingestion[/"data/Transit_stops_(current)_by_route_e040ee029227468ebf9d217402a82fa9.csv"/] --> 01_data_ingestion
  u4_01_data_ingestion[/"data/PRT_Stop_Reference_Lookup_Table.csv"/] --> 01_data_ingestion
  u5_01_data_ingestion[/"data/average-ridership/12bb84ed-397e-435c-8d1b-8ce543108698.csv"/] --> 01_data_ingestion
  t_route_stops[("route_stops")] --> 42_allegheny_go_equity
  01_data_ingestion[["Data Ingestion"]] --> t_route_stops
  t_stops[("stops")] --> 42_allegheny_go_equity
  01_data_ingestion[["Data Ingestion"]] --> t_stops
  d1_42_allegheny_go_equity(("polars (lib)")) --> 42_allegheny_go_equity
  d2_42_allegheny_go_equity(("scipy (lib)")) --> 42_allegheny_go_equity
  classDef page fill:#dbeafe,stroke:#1d4ed8,color:#1e3a8a,stroke-width:2px;
  classDef table fill:#ecfeff,stroke:#0e7490,color:#164e63;
  classDef dep fill:#fff7ed,stroke:#c2410c,color:#7c2d12,stroke-dasharray: 4 2;
  classDef file fill:#eef2ff,stroke:#6366f1,color:#3730a3;
  classDef api fill:#f0fdf4,stroke:#16a34a,color:#14532d;
  classDef pipeline fill:#f5f3ff,stroke:#7c3aed,color:#4c1d95;
  class 42_allegheny_go_equity page;
  class t_otp_monthly,t_route_stops,t_stops table;
  class d1_42_allegheny_go_equity,d2_42_allegheny_go_equity dep;
  class f1_42_allegheny_go_equity,f2_42_allegheny_go_equity,u1_01_data_ingestion,u2_01_data_ingestion,u3_01_data_ingestion,u4_01_data_ingestion,u5_01_data_ingestion file;
  class 01_data_ingestion pipeline;

Findings

Findings: Allegheny Go Equity

Summary

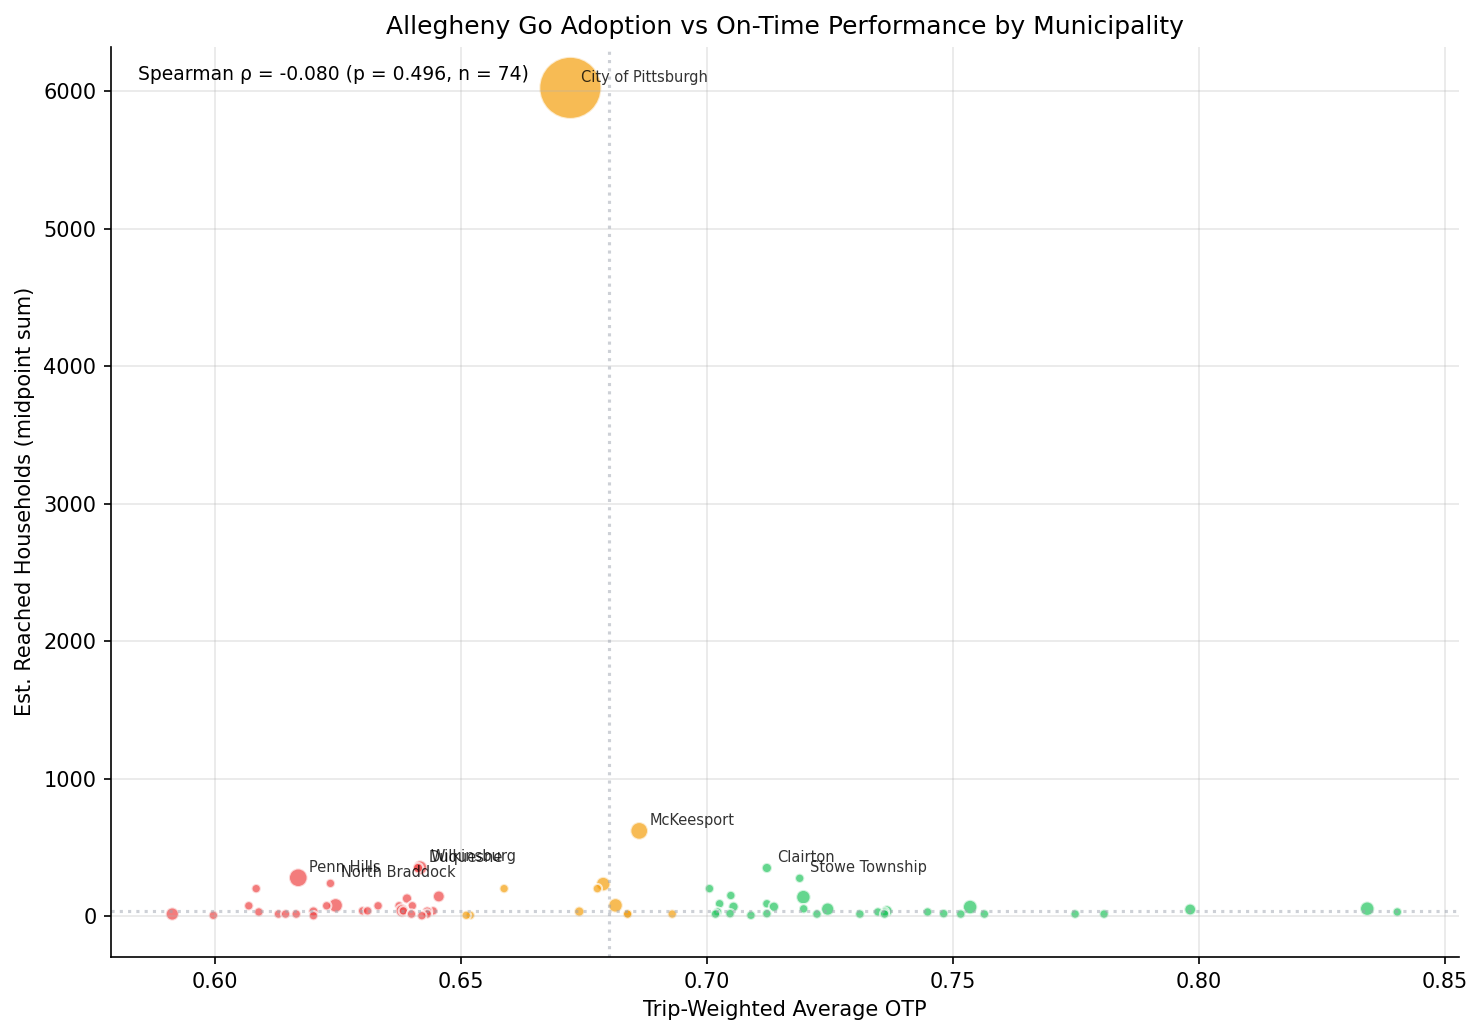
There is no statistically significant relationship between municipal on-time performance and Allegheny Go program adoption. The Spearman correlation between trip-weighted OTP and estimated reached households is ρ = −0.080 (p = 0.496, n = 74 municipalities). This result is robust to removing Pittsburgh (ρ = −0.079, p = 0.504).

Key Numbers

  • 74 of 99 tract municipalities matched to OTP data (75% match rate)
  • Spearman ρ = −0.080 (p = 0.496) — no significant association
  • Pittsburgh dominates adoption: 6,025 estimated reached households across 111 census tracts
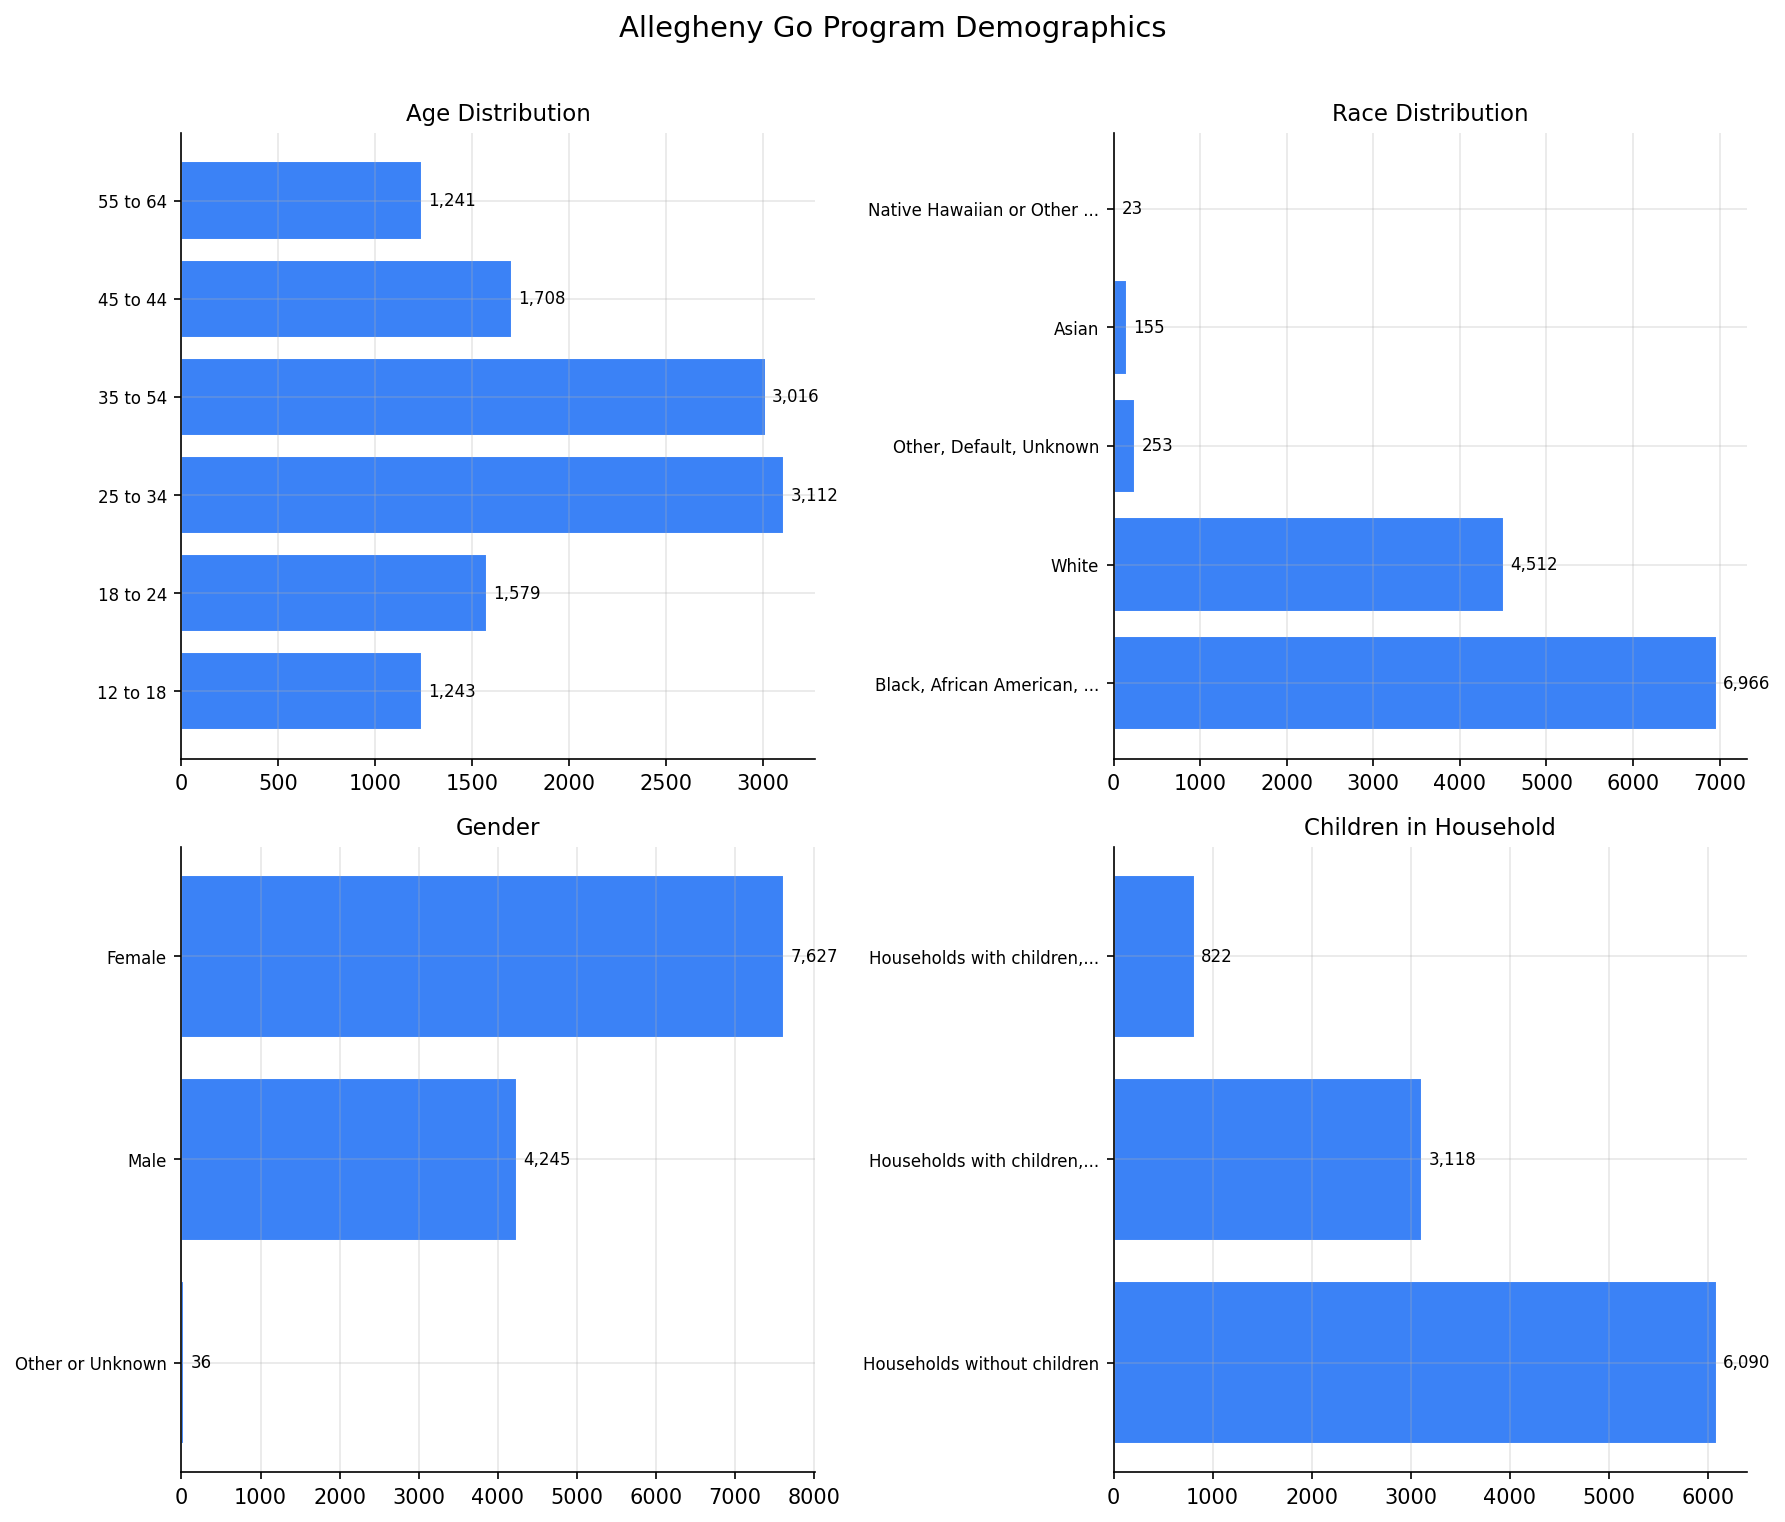
  • Program demographics: 59% Black, 64% female, 26% aged 25–34
  • 71% of rides taken by participants who have enrolled

Observations

  • Pittsburgh dominates the data. With 111 of 326 tracts and an estimated 6,025 reached households, Pittsburgh is a massive outlier. Even removing it does not change the null result.
  • Adoption appears driven by population density and program outreach, not by transit service quality. Municipalities with large low-income populations (Pittsburgh, McKeesport, Wilkinsburg) have high adoption regardless of OTP.
  • Demographics suggest the program reaches its target population. 59% of participants are Black (vs ~13% of Allegheny County), and 64% are female. The age distribution skews younger (25–34 is the largest group at 3,112).
  • Municipalities with poor OTP do not have systematically lower adoption. Penn Hills (OTP 0.617, 279 households) and North Braddock (OTP 0.623, 238 households) have high adoption despite poor service. This suggests the program successfully reaches areas with unreliable transit.

Caveats

  • Reached-household tiers (1-5, 6-25, etc.) are converted to midpoints for aggregation. The 101-500 tier has a very wide range; results are directionally consistent using ordinal ranks instead.
  • 25 tract municipalities had no match in the OTP data, mostly areas without PRT bus service (e.g., Pine Township, Forward Township). These are correctly excluded.
  • This is an ecological analysis at the municipality level. Individual-level claims about OTP and program participation cannot be drawn.
  • OTP data covers 2019-01 to 2025-11, while adoption data is a snapshot; the temporal mismatch could mask relationships.

Validation

  1. Data source verified. Tract reach data from Allegheny Go Tableau dashboard; OTP aggregation uses the same pattern as Analysis 15.
  2. Geographic scope matches. Both datasets cover Allegheny County municipalities.
  3. Null handling. Tracts with "Unpopulated Areas" and "%null%" municipalities filtered out before joining.
  4. Aggregates sanity-checked. Total midpoint households (~12,000) is consistent with the ~11,900 enrolled participants reported in program demographics.
  5. Surprising result investigated. The null correlation was checked with and without Pittsburgh, and with ordinal vs midpoint encoding. The null holds across all specifications.

Output
Methods

Methods: Allegheny Go Equity

Question

Do municipalities with poor on-time performance have higher or lower Allegheny Go fare-program adoption? If low-income residents disproportionately live in areas with unreliable bus service, the program's benefits may be undercut by poor service quality.

Approach

  1. Load tract-level Allegheny Go adoption data (tract_reach.csv), which reports reached households per census tract in five tiers (1-5, 6-25, 26-50, 51-100, 101-500). Convert tiers to numeric midpoints for aggregation.
  2. Aggregate adoption to municipality level (sum of midpoint households, count of tracts).
  3. Compute municipality-level trip-weighted OTP from route_stops, stops, and otp_monthly, following the same pre-aggregation pattern as Analysis 15.
  4. Join adoption and OTP on normalized municipality name.
  5. Compute Spearman rank correlation between municipal adoption and OTP. Run with and without Pittsburgh as a robustness check.
  6. Summarize program demographics as context.

Data

Name Description Source
tract_reach.csv Census-tract-level Allegheny Go enrollment reach data/allegheny-go/
demographics_summary.csv Program demographics by age/race/gender/children data/allegheny-go/
stops Municipality for each stop prt.db table
route_stops Links routes to stops with trip counts prt.db table
otp_monthly Monthly OTP per route prt.db table

Output

  • muni_adoption_otp.csv — per-municipality OTP and Allegheny Go adoption
  • adoption_vs_otp.png — scatter of adoption vs OTP by municipality
  • demographics_summary.png — bar charts of program demographics

Source Code

"""Analysis 42: cross-reference Allegheny Go adoption with municipal OTP."""

import re

import polars as pl
from scipy import stats

from prt_otp_analysis.common import (
    DATA_DIR,
    OTP_GOOD_THRESHOLD,
    OTP_WARNING_THRESHOLD,
    analysis_dir,
    phase,
    query_to_polars,
    run_analysis,
    save_chart,
    save_csv,
    setup_plotting,
    weighted_mean,
)

OUT = analysis_dir(__file__)
AG_DIR = DATA_DIR / "allegheny-go"
MIN_STOPS = 10

TIER_MIDPOINTS: dict[str, int] = {
    "1 - 5": 3,
    "6 - 25": 15,
    "26 - 50": 38,
    "51 - 100": 75,
    "101 - 500": 200,
}

# Regex to extract the base municipality name from the DB format
# "Baldwin borough (Allegheny, PA)" → "baldwin"
_DB_MUNI_RE = re.compile(
    r"^(.+?)\s+(?:borough|city|township|municipality)\s+\(",
    re.IGNORECASE,
)


def normalize_muni(name: str) -> str:
    """Normalize a municipality name to a lowercase key for joining."""
    # DB format: "Baldwin borough (Allegheny, PA)"
    m = _DB_MUNI_RE.match(name)
    if m:
        return m.group(1).strip().lower()
    # Tract format: "Baldwin Borough", "City of Pittsburgh", "Ross Township"
    key = name.strip()
    if key.lower().startswith("city of "):
        key = key[8:]
    for suffix in [" Borough", " Township", " Municipality", " borough", " township"]:
        if key.endswith(suffix):
            key = key[: -len(suffix)]
    return key.lower()


def load_tract_reach() -> pl.DataFrame:
    """Load tract reach data with midpoint households."""
    tract_df = pl.read_csv(AG_DIR / "tract_reach.csv")
    tract_df = tract_df.filter(
        (pl.col("municipality") != "Unpopulated Areas")
        & (pl.col("municipality") != "%null%")
        & pl.col("municipality").is_not_null()
    )
    tract_df = tract_df.with_columns(
        midpoint=pl.col("reached_households").replace_strict(
            TIER_MIDPOINTS, return_dtype=pl.Int64
        ),
        muni_key=pl.col("municipality").map_elements(
            normalize_muni, return_dtype=pl.Utf8
        ),
    )
    return tract_df


def aggregate_adoption(tract_df: pl.DataFrame) -> pl.DataFrame:
    """Aggregate tract-level adoption to municipality level."""
    return (
        tract_df.group_by("muni_key")
        .agg(
            municipality=pl.col("municipality").first(),
            total_households=pl.col("midpoint").sum(),
            n_tracts=pl.len(),
            mean_lat=pl.col("lat").mean(),
            mean_lon=pl.col("lon").mean(),
        )
        .sort("total_households", descending=True)
    )


def load_muni_otp() -> pl.DataFrame:
    """Compute trip-weighted OTP per municipality (same pattern as Analysis 15)."""
    stop_otp_df = query_to_polars("""
        SELECT rs.stop_id, rs.route_id, rs.trips_wd,
               s.muni, s.county,
               AVG(o.otp) AS route_avg_otp
        FROM route_stops rs
        JOIN stops s ON rs.stop_id = s.stop_id
        JOIN otp_monthly o ON rs.route_id = o.route_id
        WHERE s.muni IS NOT NULL AND s.muni != '0'
        GROUP BY rs.stop_id, rs.route_id, rs.trips_wd, s.muni, s.county
    """)

    muni_otp_df = (
        stop_otp_df.group_by("muni", "county")
        .agg(
            avg_otp=weighted_mean("route_avg_otp", "trips_wd"),
            n_stops=pl.col("stop_id").n_unique(),
            n_routes=pl.col("route_id").n_unique(),
        )
        .filter(pl.col("n_stops") >= MIN_STOPS)
        .with_columns(
            muni_key=pl.col("muni").map_elements(
                normalize_muni, return_dtype=pl.Utf8
            ),
        )
    )
    return muni_otp_df


def join_adoption_otp(
    adoption_df: pl.DataFrame, muni_otp_df: pl.DataFrame
) -> pl.DataFrame:
    """Join adoption and OTP on normalized municipality name."""
    joined_df = adoption_df.join(muni_otp_df, on="muni_key", how="inner")

    n_adoption = len(adoption_df)
    n_otp = len(muni_otp_df)
    n_joined = len(joined_df)
    print(f"  Adoption municipalities: {n_adoption}")
    print(f"  OTP municipalities (≥{MIN_STOPS} stops): {n_otp}")
    print(f"  Matched: {n_joined}")
    print(f"  Unmatched adoption: {n_adoption - n_joined}")

    return joined_df.sort("total_households", descending=True)


def analyze(joined_df: pl.DataFrame) -> dict[str, float]:
    """Compute correlation between adoption and OTP."""
    results: dict[str, float] = {}
    households = joined_df["total_households"].to_list()
    otp = joined_df["avg_otp"].to_list()

    rho, p = stats.spearmanr(households, otp)
    results["spearman_rho"] = rho
    results["spearman_p"] = p
    results["n_munis"] = len(joined_df)

    # Robustness: without Pittsburgh
    no_pgh_df = joined_df.filter(pl.col("muni_key") != "pittsburgh")
    if len(no_pgh_df) > 3:
        rho2, p2 = stats.spearmanr(
            no_pgh_df["total_households"].to_list(),
            no_pgh_df["avg_otp"].to_list(),
        )
        results["spearman_rho_no_pgh"] = rho2
        results["spearman_p_no_pgh"] = p2
        results["n_munis_no_pgh"] = len(no_pgh_df)

    return results


def make_scatter(joined_df: pl.DataFrame, results: dict[str, float]) -> None:
    """Scatter plot of adoption vs OTP by municipality."""
    plt = setup_plotting()
    fig, ax = plt.subplots(figsize=(10, 7))

    otp = joined_df["avg_otp"].to_list()
    households = joined_df["total_households"].to_list()
    n_tracts = joined_df["n_tracts"].to_list()

    sizes = [max(20, t * 8) for t in n_tracts]
    colors = [
        "#22c55e" if v >= OTP_GOOD_THRESHOLD
        else "#f59e0b" if v >= OTP_WARNING_THRESHOLD
        else "#ef4444"
        for v in otp
    ]

    ax.scatter(otp, households, s=sizes, c=colors, alpha=0.7, edgecolors="white")

    # Label top municipalities by adoption
    top_df = joined_df.sort("total_households", descending=True).head(8)
    for row in top_df.iter_rows(named=True):
        ax.annotate(
            row["municipality"],
            (row["avg_otp"], row["total_households"]),
            fontsize=7, alpha=0.8,
            xytext=(5, 3), textcoords="offset points",
        )

    # Reference lines
    median_otp = joined_df["avg_otp"].median()
    median_adopt = joined_df["total_households"].median()
    ax.axvline(median_otp, color="#9ca3af", linestyle=":", alpha=0.5)
    ax.axhline(median_adopt, color="#9ca3af", linestyle=":", alpha=0.5)

    rho = results["spearman_rho"]
    p = results["spearman_p"]
    ax.set_title("Allegheny Go Adoption vs On-Time Performance by Municipality")
    ax.set_xlabel("Trip-Weighted Average OTP")
    ax.set_ylabel("Est. Reached Households (midpoint sum)")
    ax.text(
        0.02, 0.98,
        f"Spearman ρ = {rho:.3f} (p = {p:.3f}, n = {results['n_munis']})",
        transform=ax.transAxes, fontsize=9, va="top",
    )

    save_chart(fig, OUT / "adoption_vs_otp.png")


def make_demographics_chart() -> None:
    """Bar charts summarizing program demographics."""
    plt = setup_plotting()
    demo_df = pl.read_csv(AG_DIR / "demographics_summary.csv")

    categories = ["age", "race", "gender", "children_in_household"]
    titles = ["Age Distribution", "Race Distribution", "Gender", "Children in Household"]

    fig, axes = plt.subplots(2, 2, figsize=(12, 10))
    axes = axes.flatten()

    for ax, cat, title in zip(axes, categories, titles):
        subset_df = demo_df.filter(pl.col("category") == cat)
        groups = subset_df["group"].to_list()
        counts = subset_df["count"].to_list()

        # Wrap long labels
        groups = [g[:25] + "..." if len(g) > 28 else g for g in groups]

        bars = ax.barh(range(len(groups)), counts, color="#3b82f6", edgecolor="white")
        ax.set_yticks(range(len(groups)))
        ax.set_yticklabels(groups, fontsize=8)
        ax.set_title(title, fontsize=11)
        ax.invert_yaxis()
        for i, c in enumerate(counts):
            ax.text(c + max(counts) * 0.01, i, f"{c:,}", va="center", fontsize=8)

    fig.suptitle("Allegheny Go Program Demographics", fontsize=14, y=1.01)
    fig.tight_layout()
    save_chart(fig, OUT / "demographics_summary.png")


@run_analysis(42, "Allegheny Go Equity")
def main() -> None:
    """Entry point: cross-reference Allegheny Go adoption with municipal OTP."""
    with phase("Loading tract reach data"):
        tract_df = load_tract_reach()
        print(f"  {len(tract_df)} tracts after filtering")
        adoption_df = aggregate_adoption(tract_df)
        print(f"  {len(adoption_df)} municipalities with adoption data")

    with phase("Loading municipal OTP"):
        muni_otp_df = load_muni_otp()
        print(f"  {len(muni_otp_df)} municipalities with ≥{MIN_STOPS} stops")

    with phase("Joining and analyzing"):
        joined_df = join_adoption_otp(adoption_df, muni_otp_df)
        results = analyze(joined_df)

        rho = results["spearman_rho"]
        p = results["spearman_p"]
        print(f"  Spearman ρ = {rho:.3f} (p = {p:.3f})")
        if "spearman_rho_no_pgh" in results:
            print(
                f"  Without Pittsburgh: ρ = {results['spearman_rho_no_pgh']:.3f} "
                f"(p = {results['spearman_p_no_pgh']:.3f})"
            )

        save_csv(joined_df.select(
            "municipality", "muni", "avg_otp", "n_stops", "n_routes",
            "total_households", "n_tracts",
        ), OUT / "muni_adoption_otp.csv")

    with phase("Generating charts"):
        make_scatter(joined_df, results)
        make_demographics_chart()


if __name__ == "__main__":
    main()

Sources

NameTypeWhy It MattersOwnerFreshnessCaveat
data/allegheny-go/tract_reach.csv file Allegheny Go households reached per census tract. Local project data owner not specified. Snapshot file; refresh by rerunning its pipeline step. May lag upstream source updates.
data/allegheny-go/demographics_summary.csv file Allegheny Go enrollee demographic summary. Local project data owner not specified. Snapshot file; refresh by rerunning its pipeline step. May lag upstream source updates.
otp_monthly table Primary analytical table used in this page's computations. Produced by Data Ingestion. Updated when the producing pipeline step is rerun. Coverage depends on upstream source availability and ETL assumptions.
Upstream sources (5)
  • file data/routes_by_month.csv — Monthly route OTP source table in wide format.
  • file data/PRT_Current_Routes_Full_System_de0e48fcbed24ebc8b0d933e47b56682.csv — Current route metadata and mode classifications.
  • file data/Transit_stops_(current)_by_route_e040ee029227468ebf9d217402a82fa9.csv — Current stop-to-route coverage and trip counts.
  • file data/PRT_Stop_Reference_Lookup_Table.csv — Historical stop reference file with geography attributes.
  • file data/average-ridership/12bb84ed-397e-435c-8d1b-8ce543108698.csv — Average ridership by route and month.
route_stops table Primary analytical table used in this page's computations. Produced by Data Ingestion. Updated when the producing pipeline step is rerun. Coverage depends on upstream source availability and ETL assumptions.
Upstream sources (5)
  • file data/routes_by_month.csv — Monthly route OTP source table in wide format.
  • file data/PRT_Current_Routes_Full_System_de0e48fcbed24ebc8b0d933e47b56682.csv — Current route metadata and mode classifications.
  • file data/Transit_stops_(current)_by_route_e040ee029227468ebf9d217402a82fa9.csv — Current stop-to-route coverage and trip counts.
  • file data/PRT_Stop_Reference_Lookup_Table.csv — Historical stop reference file with geography attributes.
  • file data/average-ridership/12bb84ed-397e-435c-8d1b-8ce543108698.csv — Average ridership by route and month.
stops table Primary analytical table used in this page's computations. Produced by Data Ingestion. Updated when the producing pipeline step is rerun. Coverage depends on upstream source availability and ETL assumptions.
Upstream sources (5)
  • file data/routes_by_month.csv — Monthly route OTP source table in wide format.
  • file data/PRT_Current_Routes_Full_System_de0e48fcbed24ebc8b0d933e47b56682.csv — Current route metadata and mode classifications.
  • file data/Transit_stops_(current)_by_route_e040ee029227468ebf9d217402a82fa9.csv — Current stop-to-route coverage and trip counts.
  • file data/PRT_Stop_Reference_Lookup_Table.csv — Historical stop reference file with geography attributes.
  • file data/average-ridership/12bb84ed-397e-435c-8d1b-8ce543108698.csv — Average ridership by route and month.
polars dependency Runtime dependency required for this page's pipeline or analysis code. Open-source Python ecosystem maintainers. Version pinned by project environment until dependency updates are applied. Library updates may change behavior or defaults.
scipy dependency Runtime dependency required for this page's pipeline or analysis code. Open-source Python ecosystem maintainers. Version pinned by project environment until dependency updates are applied. Library updates may change behavior or defaults.