Analysis
11: Directional Asymmetry
Route and Service Drivers
Coverage: 2019-01 to 2025-11 (from otp_monthly).
Built 2026-06-15 11:52 UTC · Commit e5cf673
Page Navigation
Analysis Navigation
Data Provenance
flowchart LR
  11_directional_asymmetry(["11: Directional Asymmetry"])
  t_otp_monthly[("otp_monthly")] --> 11_directional_asymmetry
  01_data_ingestion[["Data Ingestion"]] --> t_otp_monthly
  u1_01_data_ingestion[/"data/routes_by_month.csv"/] --> 01_data_ingestion
  u2_01_data_ingestion[/"data/PRT_Current_Routes_Full_System_de0e48fcbed24ebc8b0d933e47b56682.csv"/] --> 01_data_ingestion
  u3_01_data_ingestion[/"data/Transit_stops_(current)_by_route_e040ee029227468ebf9d217402a82fa9.csv"/] --> 01_data_ingestion
  u4_01_data_ingestion[/"data/PRT_Stop_Reference_Lookup_Table.csv"/] --> 01_data_ingestion
  u5_01_data_ingestion[/"data/average-ridership/12bb84ed-397e-435c-8d1b-8ce543108698.csv"/] --> 01_data_ingestion
  t_route_stops[("route_stops")] --> 11_directional_asymmetry
  01_data_ingestion[["Data Ingestion"]] --> t_route_stops
  t_routes[("routes")] --> 11_directional_asymmetry
  01_data_ingestion[["Data Ingestion"]] --> t_routes
  d1_11_directional_asymmetry(("polars (lib)")) --> 11_directional_asymmetry
  d2_11_directional_asymmetry(("scipy (lib)")) --> 11_directional_asymmetry
  classDef page fill:#dbeafe,stroke:#1d4ed8,color:#1e3a8a,stroke-width:2px;
  classDef table fill:#ecfeff,stroke:#0e7490,color:#164e63;
  classDef dep fill:#fff7ed,stroke:#c2410c,color:#7c2d12,stroke-dasharray: 4 2;
  classDef file fill:#eef2ff,stroke:#6366f1,color:#3730a3;
  classDef api fill:#f0fdf4,stroke:#16a34a,color:#14532d;
  classDef pipeline fill:#f5f3ff,stroke:#7c3aed,color:#4c1d95;
  class 11_directional_asymmetry page;
  class t_otp_monthly,t_route_stops,t_routes table;
  class d1_11_directional_asymmetry,d2_11_directional_asymmetry dep;
  class u1_01_data_ingestion,u2_01_data_ingestion,u3_01_data_ingestion,u4_01_data_ingestion,u5_01_data_ingestion file;
  class 01_data_ingestion pipeline;
Findings
Findings: Directional Asymmetry
Summary
The correlation between directional trip imbalance and OTP is weak and not statistically significant (r = -0.12, p = 0.26). After correcting methodology issues in the original analysis, PRT routes show very little directional asymmetry, and what asymmetry exists does not predict OTP.
Key Numbers
- All routes: Pearson r = -0.12 (p = 0.26, n = 90)
- Bus only: Pearson r = -0.12 (p = 0.28, n = 87)
- Bus only: Spearman r = -0.17 (p = 0.11)
- Maximum asymmetry index: 0.077 (Route 19L)
Methodology Note
The original analysis used SUM(trips_wd) per direction and excluded stops with direction = 'IB,OB'. This inflated asymmetry because IB,OB stops (common on shared corridors) were dropped rather than counted in both directions. Routes 11 and 60 appeared 100% asymmetric because their IB stops were all coded as IB,OB. The corrected analysis uses MAX(trips_wd) per direction (peak frequency, not total stop-visits), includes IB,OB stops in both directions, and excludes routes present in only one direction.
Most Asymmetric Routes
| Route | IB Trips | OB Trips | Asymmetry | OTP |
|---|---|---|---|---|
| 19L - Emsworth Limited | 7 | 6 | 0.077 | 66.0% |
| 67 - Monroeville | 27 | 25 | 0.038 | 60.4% |
| 29 - Robinson | 22 | 21 | 0.023 | 65.1% |
Observations
- With corrected methodology, PRT routes are remarkably balanced directionally. The most asymmetric route (19L) has only a 7.7% imbalance (7 vs 6 trips), and most routes are at or near 0%.
- The previous finding of routes with 100% asymmetry (Routes 11 and 60) was a data artifact caused by excluding bidirectional (IB,OB) stops. These routes are excluded in the corrected analysis because they lack separate IB and OB data after the fix.
- The slight negative correlation (r = -0.12) suggests marginally worse OTP with more asymmetry, but the effect is too small and not statistically significant.
Conclusion
Directional imbalance does not predict OTP. PRT routes are sufficiently balanced that this is not a measurable factor in schedule adherence. The hypothesis that scheduling asymmetry creates operational strain is not supported by this data.
Caveats
- The analysis uses peak trip frequency (
MAX(trips_wd)) at a single stop per direction, which may not capture all scheduling nuances. - The
route_stopsdata reflects current service, not historical. Historical asymmetry may have differed. - Including IB,OB stops in both directions can compress the asymmetry index toward zero when an IB,OB stop has the highest
trips_wdfor a route. In that case, both IB and OB MAX values equal the same number, mechanically forcing asymmetry to zero. This is a known limitation -- the alternative (excluding IB,OB stops) creates the opposite bias by dropping data. - Routes with fewer than 12 months of OTP data are excluded.
- Three correlation tests were run (Pearson all-routes, Pearson bus-only, Spearman bus-only) without multiple-comparison correction. Since all three are non-significant (smallest p = 0.11), correction would not change any conclusion.
Review History
- 2026-02-11: RED-TEAM-REPORTS/2026-02-11-analyses-01-05-07-11.md -- 7 issues (1 significant). Updated METHODS.md to correctly describe IB,OB handling (include in both, not exclude); corrected "total trips" to "peak frequency (MAX)"; added minimum-month filter (HAVING COUNT >= 12); added NULL filter for trips_wd; replaced manual regression with scipy.stats.linregress; documented IB,OB compression effect; noted multiple-test caveat.
Output
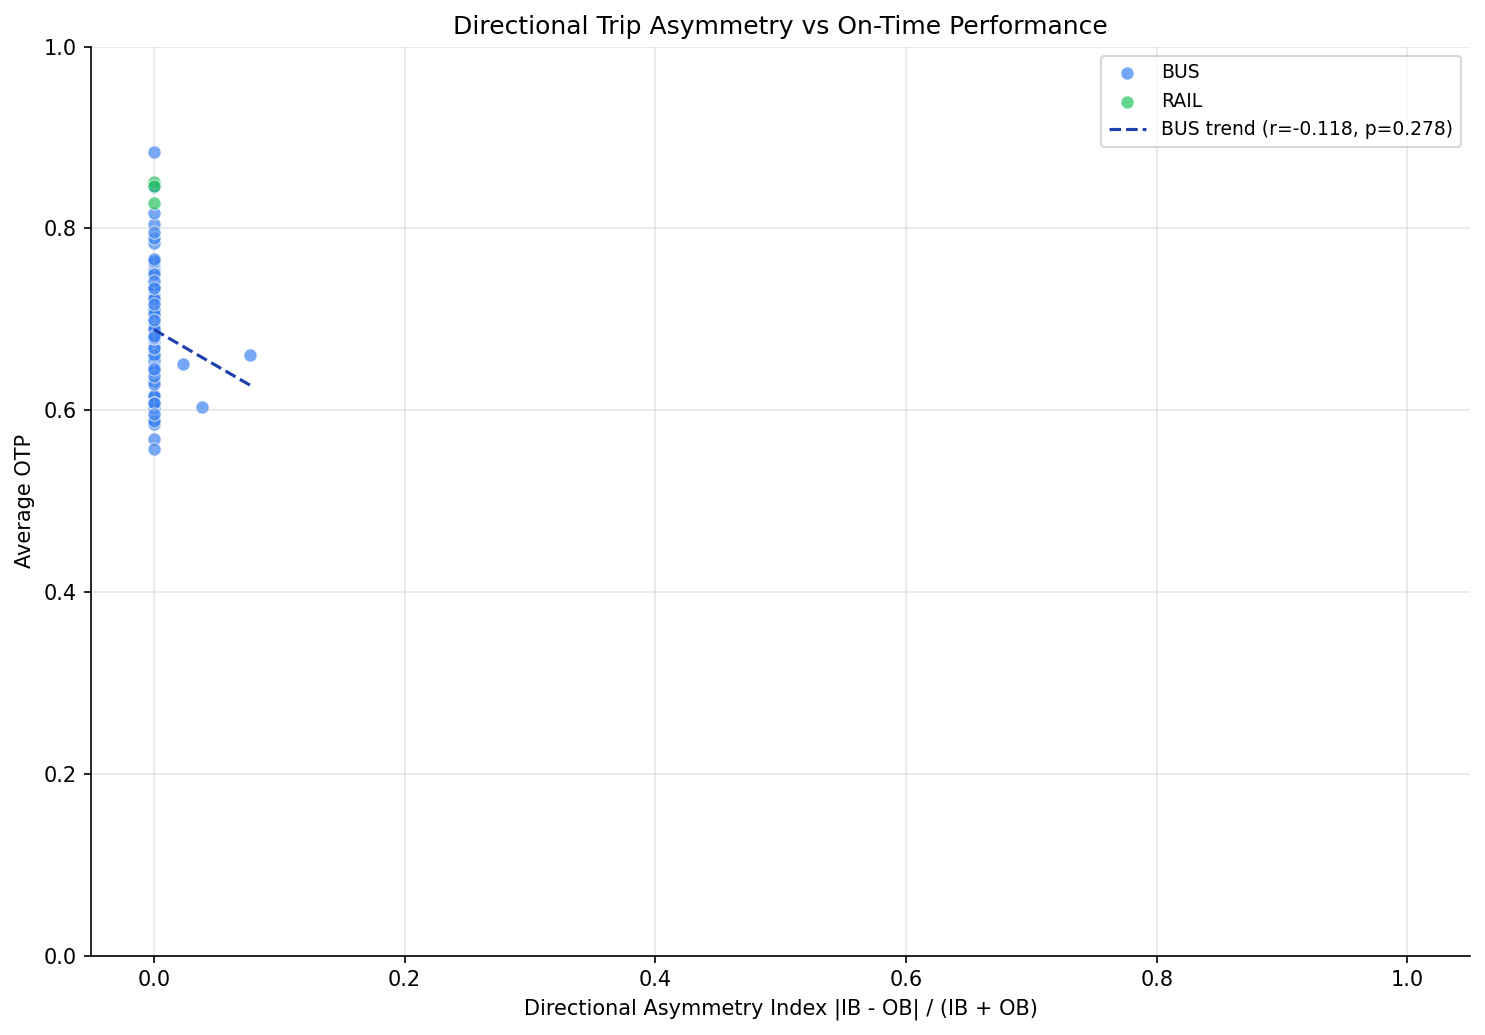
scatter plot of asymmetry vs OTP.
No interactive outputs declared.
per-route directional trip breakdown and OTP.
Preview CSV
Methods
Methods: Inbound vs Outbound Asymmetry
Question
Does a structural directional imbalance in trip frequency correlate with worse OTP? Routes with significantly different IB vs OB trip counts may face operational challenges.
Approach
- For each route, compute peak IB frequency and peak OB frequency (
MAX(trips_wd)) fromroute_stops. Stops withtrips_wd IS NULLare excluded. - Include stops with
IB,OBdirection in both IB and OB counts to avoid exclusion bias. - Compute an asymmetry index: abs(IB_trips - OB_trips) / (IB_trips + OB_trips).
- Compute average OTP per route from
otp_monthly, requiring at least 12 months of data (HAVING COUNT(*) >= 12). - Correlate asymmetry with average OTP using Pearson (all routes), Pearson (bus-only), and Spearman (bus-only).
- Investigate routes with highest asymmetry.
Data
| Name | Description | Source |
|---|---|---|
route_stops |
Directional trip counts | prt.db table |
otp_monthly |
OTP per route | prt.db table |
routes |
Route metadata | prt.db table |
Output
Source Code
|
Sources
| Name | Type | Why It Matters | Owner | Freshness | Caveat |
|---|---|---|---|---|---|
| otp_monthly | table | Primary analytical table used in this page's computations. | Produced by Data Ingestion. | Updated when the producing pipeline step is rerun. | Coverage depends on upstream source availability and ETL assumptions. |
Upstream sources (5)
|
|||||
| route_stops | table | Primary analytical table used in this page's computations. | Produced by Data Ingestion. | Updated when the producing pipeline step is rerun. | Coverage depends on upstream source availability and ETL assumptions. |
Upstream sources (5)
|
|||||
| routes | table | Primary analytical table used in this page's computations. | Produced by Data Ingestion. | Updated when the producing pipeline step is rerun. | Coverage depends on upstream source availability and ETL assumptions. |
Upstream sources (5)
|
|||||
| polars | dependency | Runtime dependency required for this page's pipeline or analysis code. | Open-source Python ecosystem maintainers. | Version pinned by project environment until dependency updates are applied. | Library updates may change behavior or defaults. |
| scipy | dependency | Runtime dependency required for this page's pipeline or analysis code. | Open-source Python ecosystem maintainers. | Version pinned by project environment until dependency updates are applied. | Library updates may change behavior or defaults. |