Analysis

36 - National Ridership Growth (2019 vs 2024)

Equity and Strategic Planning

Coverage: 2002-01 to 2025-12 (from ntd_ridership).

Built 2026-04-03 20:09 UTC · Commit 7c56b9a

Page Navigation

Analysis Navigation

Data Provenance

flowchart LR
  36_national_ridership_growth(["36 - National Ridership Growth (2019 vs 2024)"])
  t_ntd_agency[("ntd_agency")] --> 36_national_ridership_growth
  05_ntd_ridership[["NTD Ridership ETL"]] --> t_ntd_agency
  u1_05_ntd_ridership[/"data/ntd-monthly-ridership/December 2025 Complete Monthly Ridership (with adjustments and estimates)_260202.xlsx"/] --> 05_ntd_ridership
  t_ntd_ridership[("ntd_ridership")] --> 36_national_ridership_growth
  05_ntd_ridership[["NTD Ridership ETL"]] --> t_ntd_ridership
  d1_36_national_ridership_growth(("polars (lib)")) --> 36_national_ridership_growth
  classDef page fill:#dbeafe,stroke:#1d4ed8,color:#1e3a8a,stroke-width:2px;
  classDef table fill:#ecfeff,stroke:#0e7490,color:#164e63;
  classDef dep fill:#fff7ed,stroke:#c2410c,color:#7c2d12,stroke-dasharray: 4 2;
  classDef file fill:#eef2ff,stroke:#6366f1,color:#3730a3;
  classDef api fill:#f0fdf4,stroke:#16a34a,color:#14532d;
  classDef pipeline fill:#f5f3ff,stroke:#7c3aed,color:#4c1d95;
  class 36_national_ridership_growth page;
  class t_ntd_agency,t_ntd_ridership table;
  class d1_36_national_ridership_growth dep;
  class u1_05_ntd_ridership file;
  class 05_ntd_ridership pipeline;

Findings

Findings: National Ridership Growth (2019 vs 2024)

Summary

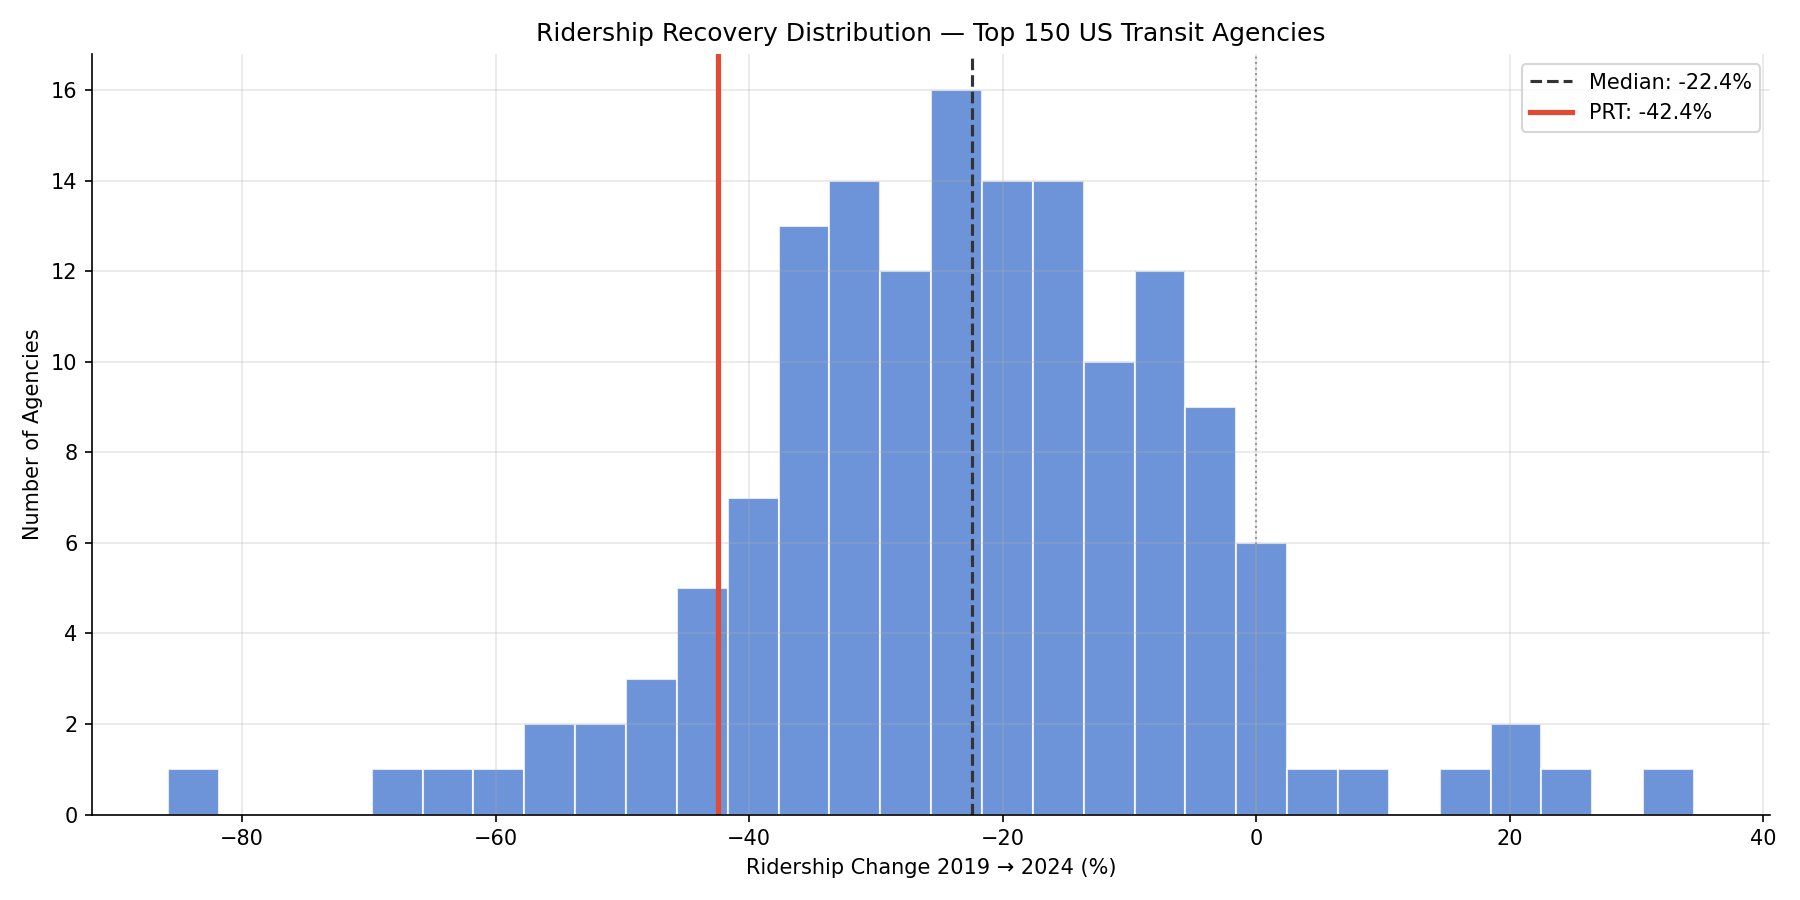
Among the 150 largest US transit agencies, the median ridership change from 2019 to 2024 was −22.4%. Only 11 of 150 agencies (7%) recovered to pre-pandemic levels. PRT ranks 136th out of 150, with a −42.4% decline.

Key Numbers

  • Median change: −22.4%
  • Mean change: −22.4%
  • IQR: −33.4% to −12.0%
  • Agencies recovered to 2019 levels: 11 / 150 (7%)
  • PRT rank: 136 / 150 (−42.4% change)
  • PRT 2019 UPT: 64.1 million → 2024 UPT: 36.9 million
  • Top recovery: City of Alexandria (+34.6%)
  • Bottom: Puerto Rico Highway and Transportation Authority (−85.8%)

Observations

  • The transit industry as a whole has not recovered to 2019 ridership levels. The median agency is still down about one-fifth.
  • Only a handful of mostly smaller or mid-size agencies — Alexandria, Richmond, Tucson, Albany — have grown past their 2019 totals, often reflecting route restructures or fare-free programs.
  • Large legacy systems (BART −56%, Metrolink −60%) lag due to heavy reliance on commuter/office workers who shifted to remote work.
  • PRT's −42.4% decline places it in the bottom quintile, substantially below the median. This is worse than most similarly-sized agencies.
  • The distribution is roughly normal around −22%, with a long left tail of commuter-heavy agencies.

Discussion

PRT's below-median recovery suggests Pittsburgh-specific headwinds beyond the national pandemic trend. Possible factors include sustained remote-work adoption in major employers (UPMC, university sector), service cuts that may have dampened demand, and light rail losses that drag the overall figure below bus-only recovery.

Caveats

  • "Top 150" is defined by 2019 UPT, which excludes agencies that have grown from a small base.
  • Requires at least 10 months of data per year to exclude partial-year artifacts; a few agencies near the cutoff may have slightly biased totals.
  • UPT counts all modes and TOS combined; agencies with large commuter rail components (which recovered less) appear worse than bus-only peers.
  • NTD data includes estimates and adjustments; some months may be revised after initial reporting.

Output

Methods

Methods: National Ridership Growth (2019 vs 2024)

Question

What is the average 2019-to-2024 ridership change across the 150 largest US transit agencies, and where does Pittsburgh Regional Transit rank?

Approach

  • Sum unlinked passenger trips (UPT) by agency across all modes/TOS for calendar years 2019 and 2024.
  • Require at least 10 months of non-null data in both years to avoid partial-year artifacts.
  • Rank agencies by 2019 total to define the "top 150" (pre-pandemic baseline, not distorted by COVID).
  • Compute percent change ((2024 − 2019) / 2019 × 100) per agency.
  • Report median, mean, and IQR of the percent change distribution.
  • Count how many agencies have recovered to or exceeded 2019 levels.
  • Identify PRT's rank in the distribution.

Data

  • ntd_ridership — monthly UPT by agency/mode/TOS, filtered to 2019 and 2024.
  • ntd_agency — agency names for labeling.

Output

  • output/ridership_growth_distribution.png — histogram of percent change with PRT highlighted.
  • output/ridership_growth_ranking.png — horizontal bar chart of all 150 agencies, PRT in distinct color.
  • output/ridership_growth_data.csv — per-agency data (ntd_id, agency_name, upt_2019, upt_2024, pct_change, rank).

Source Code

"""Compare 2019-to-2024 ridership recovery across the 150 largest US transit agencies; rank PRT."""

import polars as pl

from prt_otp_analysis.common import PRE_COVID_BASELINE_YEAR, analysis_dir, get_db, phase, run_analysis, save_chart, save_csv, setup_plotting

OUT = analysis_dir(__file__)

PRT_NTD_ID = 30022
MIN_MONTHS = 10  # require at least 10 months of data per year
TOP_N = 150


def load_agency_totals(conn) -> pl.DataFrame:
    """Sum UPT by agency for 2019 and 2024, requiring MIN_MONTHS months each."""
    rows = conn.execute("""
        SELECT
            ntd_id,
            SUBSTR(month, 1, 4) AS year,
            SUM(upt) AS total_upt,
            COUNT(CASE WHEN upt IS NOT NULL THEN 1 END) AS n_months
        FROM ntd_ridership
        WHERE SUBSTR(month, 1, 4) IN (?, '2024')
        GROUP BY ntd_id, SUBSTR(month, 1, 4)
    """, (PRE_COVID_BASELINE_YEAR,)).fetchall()

    df = pl.DataFrame([dict(r) for r in rows])

    # Require minimum months in both years
    df = df.filter(pl.col("n_months") >= MIN_MONTHS)

    # Pivot to wide: one row per agency with upt_2019 and upt_2024
    wide = df.pivot(on="year", index="ntd_id", values="total_upt")
    wide = wide.rename({"2019": "upt_2019", "2024": "upt_2024"})

    # Keep only agencies with data in both years
    wide = wide.filter(
        pl.col("upt_2019").is_not_null() & pl.col("upt_2024").is_not_null()
    )

    return wide


@run_analysis(36, "National Ridership Growth (2019 vs 2024)")
def main():
    plt = setup_plotting()
    conn = get_db()

    # Load data
    with phase("Loading agency totals"):
        wide = load_agency_totals(conn)
        print(f"   {len(wide)} agencies with valid data in both 2019 and 2024")

    # Rank by 2019 UPT and take top N
    wide = wide.sort("upt_2019", descending=True).head(TOP_N)
    print(f"   Top {TOP_N} by 2019 ridership selected")

    # Compute percent change
    wide = wide.with_columns(
        pct_change=((pl.col("upt_2024") - pl.col("upt_2019")) / pl.col("upt_2019") * 100)
    )

    # Rank by pct_change (best recovery = rank 1)
    wide = wide.sort("pct_change", descending=True).with_row_index("rank", offset=1)
    wide = wide.with_columns(pl.col("rank").cast(pl.Int64))

    # Join agency names
    name_rows = conn.execute(
        "SELECT DISTINCT ntd_id, agency_name FROM ntd_agency"
    ).fetchall()
    names = pl.DataFrame([dict(r) for r in name_rows])
    result = wide.join(names, on="ntd_id", how="left")
    result = result.select("rank", "ntd_id", "agency_name", "upt_2019", "upt_2024", "pct_change")

    conn.close()

    # Summary statistics
    pct = result["pct_change"]
    median_pct = pct.median()
    mean_pct = pct.mean()
    q25 = pct.quantile(0.25)
    q75 = pct.quantile(0.75)
    recovered = result.filter(pl.col("pct_change") >= 0)

    print("\n2. Summary statistics:")
    print(f"   Median change: {median_pct:.1f}%")
    print(f"   Mean change:   {mean_pct:.1f}%")
    print(f"   IQR:           {q25:.1f}% to {q75:.1f}%")
    print(f"   Recovered to 2019 levels: {len(recovered)} / {TOP_N} ({len(recovered)/TOP_N*100:.0f}%)")

    # PRT results
    prt = result.filter(pl.col("ntd_id") == PRT_NTD_ID)
    if len(prt) > 0:
        prt_row = prt.row(0, named=True)
        print(f"\n   PRT: rank {prt_row['rank']}/{TOP_N}, "
              f"{prt_row['pct_change']:+.1f}% change "
              f"({prt_row['upt_2019']:,.0f} → {prt_row['upt_2024']:,.0f})")
    else:
        print("\n   WARNING: PRT not found in top 150")

    # Save CSV
    print()
    save_csv(result, OUT / "ridership_growth_data.csv")

    # --- Chart 1: Histogram ---
    with phase("Generating histogram"):
        fig, ax = plt.subplots(figsize=(12, 6))
        ax.hist(pct.to_list(), bins=30, color="#4878CF", edgecolor="white", alpha=0.8)
        ax.axvline(median_pct, color="#333333", linestyle="--", linewidth=1.5, label=f"Median: {median_pct:.1f}%")
        ax.axvline(0, color="#999999", linestyle=":", linewidth=1)
        if len(prt) > 0:
            prt_pct = prt_row["pct_change"]
            ax.axvline(prt_pct, color="#E24A33", linestyle="-", linewidth=2.5,
                       label=f"PRT: {prt_pct:+.1f}%")
        ax.set_xlabel("Ridership Change 2019 → 2024 (%)")
        ax.set_ylabel("Number of Agencies")
        ax.set_title(f"Ridership Recovery Distribution — Top {TOP_N} US Transit Agencies")
        ax.legend()
        save_chart(fig, OUT / "ridership_growth_distribution.png")

    # --- Chart 2: Horizontal bar ranking ---
    with phase("Generating ranking bar chart"):
        sorted_df = result.sort("pct_change")
        agencies = sorted_df["agency_name"].to_list()
        changes = sorted_df["pct_change"].to_list()
        ntd_ids = sorted_df["ntd_id"].to_list()
        colors = ["#E24A33" if nid == PRT_NTD_ID else "#4878CF" for nid in ntd_ids]

        fig, ax = plt.subplots(figsize=(14, max(30, TOP_N * 0.22)))
        bars = ax.barh(range(len(agencies)), changes, color=colors, height=0.8)
        ax.set_yticks(range(len(agencies)))
        ax.set_yticklabels(agencies, fontsize=6)
        ax.set_xlabel("Ridership Change 2019 → 2024 (%)")
        ax.set_title(f"Ridership Recovery Ranking — Top {TOP_N} US Transit Agencies")
        ax.axvline(0, color="#999999", linestyle=":", linewidth=1)

        # Highlight PRT label
        if len(prt) > 0:
            prt_idx = [i for i, nid in enumerate(ntd_ids) if nid == PRT_NTD_ID]
            if prt_idx:
                ax.get_yticklabels()[prt_idx[0]].set_color("#E24A33")
                ax.get_yticklabels()[prt_idx[0]].set_fontweight("bold")
                ax.get_yticklabels()[prt_idx[0]].set_fontsize(7)

        save_chart(fig, OUT / "ridership_growth_ranking.png")

    # Top and bottom 10
    print("\n6. Top 10 recoveries:")
    for row in result.head(10).iter_rows(named=True):
        print(f"   {row['rank']:>3d}. {row['agency_name']:<50s} {row['pct_change']:>+7.1f}%")

    print("\n   Bottom 10:")
    for row in result.tail(10).iter_rows(named=True):
        print(f"   {row['rank']:>3d}. {row['agency_name']:<50s} {row['pct_change']:>+7.1f}%")


if __name__ == "__main__":
    main()

Sources

NameTypeWhy It MattersOwnerFreshnessCaveat
ntd_agency table Primary analytical table used in this page's computations. Produced by NTD Ridership ETL. Updated when the producing pipeline step is rerun. Coverage depends on upstream source availability and ETL assumptions.
Upstream sources (1)
  • file data/ntd-monthly-ridership/December 2025 Complete Monthly Ridership (with adjustments and estimates)_260202.xlsx — NTD monthly ridership workbook containing agency metadata and UPT series.
ntd_ridership table Primary analytical table used in this page's computations. Produced by NTD Ridership ETL. Updated when the producing pipeline step is rerun. Coverage depends on upstream source availability and ETL assumptions.
Upstream sources (1)
  • file data/ntd-monthly-ridership/December 2025 Complete Monthly Ridership (with adjustments and estimates)_260202.xlsx — NTD monthly ridership workbook containing agency metadata and UPT series.
polars dependency Runtime dependency required for this page's pipeline or analysis code. Open-source Python ecosystem maintainers. Version pinned by project environment until dependency updates are applied. Library updates may change behavior or defaults.