|
"""Analysis 28: Test whether weather explains OTP variance or the counterintuitive seasonal pattern."""
import numpy as np
import polars as pl
from scipy import stats
from prt_otp_analysis.common import analysis_dir, correlate, phase, query_to_polars, run_analysis, save_chart, save_csv, setup_plotting, weighted_mean
OUT = analysis_dir(__file__)
COMPLETE_YEAR_START = "2019-01"
COMPLETE_YEAR_END = "2024-12"
WEATHER_VARS = [
"total_precip_mm", "snow_days", "total_snow_mm",
"mean_tmax_c", "mean_tmin_c", "freeze_days",
"hot_days", "mean_wind_ms", "heavy_precip_days",
]
MONTH_LABELS = ["Jan", "Feb", "Mar", "Apr", "May", "Jun",
"Jul", "Aug", "Sep", "Oct", "Nov", "Dec"]
# ---------------------------------------------------------------------------
# Helpers
# ---------------------------------------------------------------------------
def fit_ols(y: np.ndarray, X_raw: np.ndarray, feature_names: list[str]) -> dict:
"""Fit OLS regression and return results dict."""
n, k = X_raw.shape
X = np.column_stack([np.ones(n), X_raw])
beta, _, _, _ = np.linalg.lstsq(X, y, rcond=None)
y_hat = X @ beta
residuals = y - y_hat
ss_res = np.sum(residuals ** 2)
ss_tot = np.sum((y - np.mean(y)) ** 2)
r_squared = 1 - ss_res / ss_tot
adj_r_squared = 1 - (1 - r_squared) * (n - 1) / (n - k - 1)
mse = ss_res / (n - k - 1)
XtX_inv = np.linalg.pinv(X.T @ X)
se = np.sqrt(np.diag(XtX_inv) * mse)
t_vals = beta / se
p_vals = [2 * (1 - stats.t.cdf(abs(t), df=n - k - 1)) for t in t_vals]
# Standardized beta weights
x_stds = np.std(X_raw, axis=0, ddof=1)
y_std = np.std(y, ddof=1)
beta_weights = beta[1:] * x_stds / y_std
return {
"r_squared": r_squared,
"adj_r_squared": adj_r_squared,
"ss_res": ss_res,
"n": n,
"k": k,
"features": ["intercept"] + feature_names,
"coefficients": beta.tolist(),
"std_errors": se.tolist(),
"t_values": t_vals.tolist(),
"p_values": p_vals,
"beta_weights": [None] + beta_weights.tolist(),
"y_hat": y_hat,
"residuals": residuals,
}
def f_test_nested(base: dict, full: dict) -> tuple[float, float]:
"""F-test comparing nested models. Returns (F_stat, p_value)."""
k_diff = full["k"] - base["k"]
n = full["n"]
f_stat = ((base["ss_res"] - full["ss_res"]) / k_diff) / (full["ss_res"] / (n - full["k"] - 1))
f_p = 1 - stats.f.cdf(f_stat, k_diff, n - full["k"] - 1)
return f_stat, f_p
def print_model(results: dict, label: str) -> None:
"""Print formatted model results."""
print(f"\n {label}:")
print(f" R2 = {results['r_squared']:.4f}, Adj R2 = {results['adj_r_squared']:.4f}, "
f"n = {results['n']}, k = {results['k']}")
print(f" {'Feature':<22s} {'Coeff':>10s} {'Std Err':>10s} {'p-value':>10s} {'Beta':>10s}")
print(f" {'-'*62}")
for i, feat in enumerate(results["features"]):
coeff = results["coefficients"][i]
se = results["std_errors"][i]
p = results["p_values"][i]
beta = results["beta_weights"][i]
beta_str = f"{beta:>10.4f}" if beta is not None else f"{'--':>10s}"
sig = "***" if p < 0.001 else "**" if p < 0.01 else "*" if p < 0.05 else ""
print(f" {feat:<22s} {coeff:>10.6f} {se:>10.6f} {p:>10.4f} {beta_str} {sig}")
# ---------------------------------------------------------------------------
# Data loading
# ---------------------------------------------------------------------------
def load_system_otp() -> pl.DataFrame:
"""Load trip-weighted system OTP per month (balanced panel)."""
df = query_to_polars(f"""
SELECT o.route_id, o.month, o.otp,
COALESCE(rs_agg.trips_7d, 0) AS trips_7d
FROM otp_monthly o
LEFT JOIN (
SELECT route_id, SUM(trips_7d) AS trips_7d
FROM route_stops
GROUP BY route_id
) rs_agg ON o.route_id = rs_agg.route_id
WHERE o.month >= '{COMPLETE_YEAR_START}' AND o.month <= '{COMPLETE_YEAR_END}'
""")
# Balanced panel: only routes present in all 12 months-of-year
df = df.with_columns(
month_num=pl.col("month").str.slice(5, 2).cast(pl.Int32),
)
months_per_route = (
df.group_by("route_id")
.agg(n_months_of_year=pl.col("month_num").n_unique())
)
balanced = months_per_route.filter(pl.col("n_months_of_year") == 12)["route_id"].to_list()
df = df.filter(pl.col("route_id").is_in(balanced))
# Trip-weighted system OTP per month
system = (
df.group_by("month")
.agg(
weighted_otp=weighted_mean("otp", "trips_7d", safe=True),
)
.sort("month")
)
return system
def load_weather() -> pl.DataFrame:
"""Load weather_monthly data."""
return query_to_polars("""
SELECT * FROM weather_monthly ORDER BY month
""")
def load_route_otp() -> pl.DataFrame:
"""Load route-month OTP for panel regression."""
return query_to_polars(f"""
SELECT o.route_id, o.month, o.otp, r.mode
FROM otp_monthly o
JOIN routes r ON o.route_id = r.route_id
WHERE o.month >= '{COMPLETE_YEAR_START}' AND o.month <= '{COMPLETE_YEAR_END}'
""")
# ---------------------------------------------------------------------------
# Block A: System-level weather-OTP correlation
# ---------------------------------------------------------------------------
def block_a(system: pl.DataFrame, weather: pl.DataFrame) -> pl.DataFrame:
"""System-level weather-OTP correlations and regression."""
print("\n" + "=" * 60)
print("Block A: System-Level Weather-OTP Correlation")
print("=" * 60)
# Join system OTP with weather
merged = system.join(weather, on="month", how="inner").sort("month")
print(f"\n {len(merged)} months with both OTP and weather data")
otp = merged["weighted_otp"].to_numpy()
# --- Raw correlations ---
print("\n Raw correlations (weather var vs system OTP):")
print(f" {'Variable':<22s} {'Pearson r':>10s} {'p':>8s} {'Spearman r':>10s} {'p':>8s}")
print(f" {'-'*60}")
corr_rows = []
for var in WEATHER_VARS:
c = correlate(merged, var, "weighted_otp", min_n=10)
if np.isnan(c["pearson_r"]):
continue
sig = "*" if c["pearson_p"] < 0.05 else ""
print(f" {var:<22s} {c['pearson_r']:>+10.3f} {c['pearson_p']:>8.4f} {c['spearman_r']:>+10.3f} {c['spearman_p']:>8.4f} {sig}")
corr_rows.append({
"variable": var, "pearson_r": c["pearson_r"], "pearson_p": c["pearson_p"],
"spearman_r": c["spearman_r"], "spearman_p": c["spearman_p"], "type": "raw",
})
# --- Detrended correlations ---
print("\n Detrending (12-month rolling mean)...")
merged = merged.with_columns(
otp_trend=pl.col("weighted_otp").rolling_mean(window_size=12, min_samples=6).shift(-6),
)
for var in WEATHER_VARS:
merged = merged.with_columns(
pl.col(var).rolling_mean(window_size=12, min_samples=6).shift(-6).alias(f"{var}_trend"),
)
merged = merged.with_columns(
otp_detrended=pl.col("weighted_otp") - pl.col("otp_trend"),
)
for var in WEATHER_VARS:
merged = merged.with_columns(
(pl.col(var) - pl.col(f"{var}_trend")).alias(f"{var}_detrended"),
)
# Filter to rows with valid detrended values
dt = merged.filter(pl.col("otp_detrended").is_not_null())
print(f"\n Detrended correlations ({len(dt)} months):")
print(f" {'Variable':<22s} {'Pearson r':>10s} {'p':>8s} {'Spearman r':>10s} {'p':>8s}")
print(f" {'-'*60}")
for var in WEATHER_VARS:
col = f"{var}_detrended"
c = correlate(dt, col, "otp_detrended", min_n=10)
if np.isnan(c["pearson_r"]):
continue
sig = "*" if c["pearson_p"] < 0.05 else ""
print(f" {var:<22s} {c['pearson_r']:>+10.3f} {c['pearson_p']:>8.4f} {c['spearman_r']:>+10.3f} {c['spearman_p']:>8.4f} {sig}")
corr_rows.append({
"variable": var, "pearson_r": c["pearson_r"], "pearson_p": c["pearson_p"],
"spearman_r": c["spearman_r"], "spearman_p": c["spearman_p"], "type": "detrended",
})
# --- Multiple regression: system OTP ~ weather + trend ---
print("\n Multiple regression: system OTP ~ weather variables + linear trend...")
# Use a subset of weather vars to avoid overfitting (n~72)
reg_vars = ["total_precip_mm", "snow_days", "mean_tmax_c", "freeze_days", "mean_wind_ms"]
# Add linear trend
trend_idx = np.arange(len(merged))
y = merged["weighted_otp"].to_numpy()
X_cols = [merged[v].to_numpy().astype(float) for v in reg_vars]
X_cols.append(trend_idx)
X = np.column_stack(X_cols)
# Remove rows with NaN
mask = ~np.any(np.isnan(X), axis=1)
y_clean = y[mask]
X_clean = X[mask]
names = reg_vars + ["linear_trend"]
weather_reg = fit_ols(y_clean, X_clean, names)
print_model(weather_reg, "Weather + trend model")
# Trend-only baseline for F-test
X_trend = trend_idx[mask].reshape(-1, 1)
trend_only = fit_ols(y_clean, X_trend, ["linear_trend"])
f_stat, f_p = f_test_nested(trend_only, weather_reg)
print(f"\n F-test (weather vars joint): F = {f_stat:.3f}, p = {f_p:.4f}")
print(f" R2 change: {trend_only['r_squared']:.4f} -> {weather_reg['r_squared']:.4f} "
f"(+{weather_reg['r_squared'] - trend_only['r_squared']:.4f})")
corr_df = pl.DataFrame(corr_rows)
save_csv(corr_df, OUT / "weather_otp_correlation.csv")
return merged
# ---------------------------------------------------------------------------
# Block B: Seasonal decomposition test
# ---------------------------------------------------------------------------
def block_b(merged: pl.DataFrame) -> dict:
"""Test whether weather explains the seasonal pattern."""
print("\n" + "=" * 60)
print("Block B: Seasonal Decomposition Test")
print("=" * 60)
# Prepare data: need month-of-year dummies + weather vars
merged = merged.with_columns(
month_num=pl.col("month").str.slice(5, 2).cast(pl.Int32),
)
y = merged["weighted_otp"].to_numpy()
n = len(y)
trend_idx = np.arange(n)
# Month dummies (drop January as reference)
month_nums = merged["month_num"].to_numpy()
month_dummies = np.zeros((n, 11))
for i in range(n):
m = month_nums[i]
if m > 1:
month_dummies[i, m - 2] = 1.0
month_names = [f"month_{MONTH_LABELS[i]}" for i in range(1, 12)]
# Model 1: Month dummies + trend only
print("\n Model 1: Month dummies + linear trend")
X1 = np.column_stack([month_dummies, trend_idx])
names1 = month_names + ["linear_trend"]
model_month = fit_ols(y, X1, names1)
print_model(model_month, "Month-only model")
# Model 2: Weather variables + trend only (no month dummies)
weather_cols = ["total_precip_mm", "snow_days", "mean_tmax_c", "freeze_days", "mean_wind_ms"]
X_weather = np.column_stack([merged[v].to_numpy().astype(float) for v in weather_cols])
X2 = np.column_stack([X_weather, trend_idx])
names2 = weather_cols + ["linear_trend"]
# Remove NaN rows
mask = ~np.any(np.isnan(X2), axis=1)
model_weather = fit_ols(y[mask], X2[mask], names2)
print(f"\n Model 2: Weather + linear trend")
print_model(model_weather, "Weather-only model")
# Model 3: Month dummies + weather + trend
X3 = np.column_stack([month_dummies, X_weather, trend_idx])
names3 = month_names + weather_cols + ["linear_trend"]
mask3 = ~np.any(np.isnan(X3), axis=1)
model_both = fit_ols(y[mask3], X3[mask3], names3)
print(f"\n Model 3: Month dummies + weather + linear trend")
print_model(model_both, "Month + weather model")
# F-test: does weather add to month dummies?
# Realign month-only model to same observations
X1_masked = X1[mask3]
model_month_masked = fit_ols(y[mask3], X1_masked, names1)
f_weather, fp_weather = f_test_nested(model_month_masked, model_both)
print(f"\n F-test (weather added to months): F = {f_weather:.3f}, p = {fp_weather:.4f}")
print(f" R2 change: {model_month_masked['r_squared']:.4f} -> {model_both['r_squared']:.4f} "
f"(+{model_both['r_squared'] - model_month_masked['r_squared']:.4f})")
# F-test: do month dummies add to weather?
X2_masked = X2[mask3]
model_weather_masked = fit_ols(y[mask3], X2_masked, names2)
f_months, fp_months = f_test_nested(model_weather_masked, model_both)
print(f"\n F-test (months added to weather): F = {f_months:.3f}, p = {fp_months:.4f}")
print(f" R2 change: {model_weather_masked['r_squared']:.4f} -> {model_both['r_squared']:.4f} "
f"(+{model_both['r_squared'] - model_weather_masked['r_squared']:.4f})")
# Check if month dummies remain significant in the combined model
sig_months_combined = sum(
1 for i, f in enumerate(model_both["features"])
if f.startswith("month_") and model_both["p_values"][i] < 0.05
)
print(f"\n Significant month dummies in combined model: {sig_months_combined} of 11")
if sig_months_combined == 0:
print(" => Weather fully explains the seasonal pattern (month dummies non-significant).")
elif sig_months_combined < 6:
print(" => Weather partially explains the seasonal pattern.")
else:
print(" => Weather does NOT explain the seasonal pattern (most month dummies still significant).")
# Compute seasonal profile with and without weather adjustment
# Weather-adjusted = residuals from weather-only model + grand mean
grand_mean = np.mean(y[mask3])
weather_residuals = model_weather_masked["residuals"]
adjusted_otp = weather_residuals + grand_mean
month_nums_masked = month_nums[mask3]
seasonal_raw = {}
seasonal_adj = {}
for m in range(1, 13):
idx = month_nums_masked == m
if idx.any():
seasonal_raw[m] = np.mean(y[mask3][idx])
seasonal_adj[m] = np.mean(adjusted_otp[idx])
print("\n Seasonal profile comparison:")
print(f" {'Month':<6s} {'Raw OTP':>10s} {'Weather-adj':>12s} {'Diff':>8s}")
print(f" {'-'*38}")
for m in range(1, 13):
if m in seasonal_raw:
diff = seasonal_adj[m] - seasonal_raw[m]
print(f" {MONTH_LABELS[m-1]:<6s} {seasonal_raw[m]:>10.1%} {seasonal_adj[m]:>12.1%} {diff:>+8.1%}")
return {
"model_month": model_month,
"model_weather": model_weather,
"model_both": model_both,
"seasonal_raw": seasonal_raw,
"seasonal_adj": seasonal_adj,
}
# ---------------------------------------------------------------------------
# Block C: Route-level panel regression
# ---------------------------------------------------------------------------
def block_c(route_otp: pl.DataFrame, weather: pl.DataFrame) -> dict:
"""Route-level panel regression with fixed effects."""
print("\n" + "=" * 60)
print("Block C: Route-Level Panel Regression")
print("=" * 60)
# Join weather to route-month OTP
panel = route_otp.join(weather, on="month", how="inner")
print(f"\n Panel: {len(panel)} route-month observations")
print(f" Routes: {panel['route_id'].n_unique()}, Months: {panel['month'].n_unique()}")
# Demean by route (within-route variation = fixed effects)
route_means = panel.group_by("route_id").agg(
otp_mean=pl.col("otp").mean(),
)
panel = panel.join(route_means, on="route_id")
panel = panel.with_columns(
otp_demeaned=(pl.col("otp") - pl.col("otp_mean")),
)
# Weather variables (same across routes within a month, so we just demean OTP)
y = panel["otp_demeaned"].to_numpy()
weather_cols = ["total_precip_mm", "snow_days", "mean_tmax_c", "freeze_days", "mean_wind_ms"]
X = np.column_stack([panel[v].to_numpy().astype(float) for v in weather_cols])
mask = ~np.any(np.isnan(X), axis=1) & ~np.isnan(y)
y_clean = y[mask]
X_clean = X[mask]
print(f" Clean observations: {mask.sum()}")
fe_model = fit_ols(y_clean, X_clean, weather_cols)
print_model(fe_model, "Fixed-effects panel model (route-demeaned)")
# Cluster-robust standard errors (by month)
# Since weather is constant within month, cluster by month
months_arr = panel["month"].to_numpy()[mask]
unique_months = np.unique(months_arr)
n_clusters = len(unique_months)
k = fe_model["k"]
n = fe_model["n"]
# Compute cluster-robust (CR1) standard errors
X_with_const = np.column_stack([np.ones(n), X_clean])
XtX_inv = np.linalg.pinv(X_with_const.T @ X_with_const)
meat = np.zeros((k + 1, k + 1))
for m in unique_months:
idx = months_arr == m
e_g = fe_model["residuals"][idx]
X_g = X_with_const[idx]
score_g = X_g.T @ e_g
meat += np.outer(score_g, score_g)
# Small-sample correction
correction = n_clusters / (n_clusters - 1) * (n - 1) / (n - k - 1)
sandwich = XtX_inv @ meat @ XtX_inv * correction
cluster_se = np.sqrt(np.diag(sandwich))
cluster_t = np.array(fe_model["coefficients"]) / cluster_se
cluster_p = [2 * (1 - stats.t.cdf(abs(t), df=n_clusters - 1)) for t in cluster_t]
print(f"\n Cluster-robust SEs (clustered by month, {n_clusters} clusters):")
print(f" {'Feature':<22s} {'Coeff':>10s} {'Cluster SE':>10s} {'p-value':>10s}")
print(f" {'-'*54}")
for i, feat in enumerate(fe_model["features"]):
coeff = fe_model["coefficients"][i]
se = cluster_se[i]
p = cluster_p[i]
sig = "***" if p < 0.001 else "**" if p < 0.01 else "*" if p < 0.05 else ""
print(f" {feat:<22s} {coeff:>10.6f} {se:>10.6f} {p:>10.4f} {sig}")
return {
"fe_model": fe_model,
"cluster_se": cluster_se,
"cluster_p": cluster_p,
"n_clusters": n_clusters,
}
# ---------------------------------------------------------------------------
# Charts
# ---------------------------------------------------------------------------
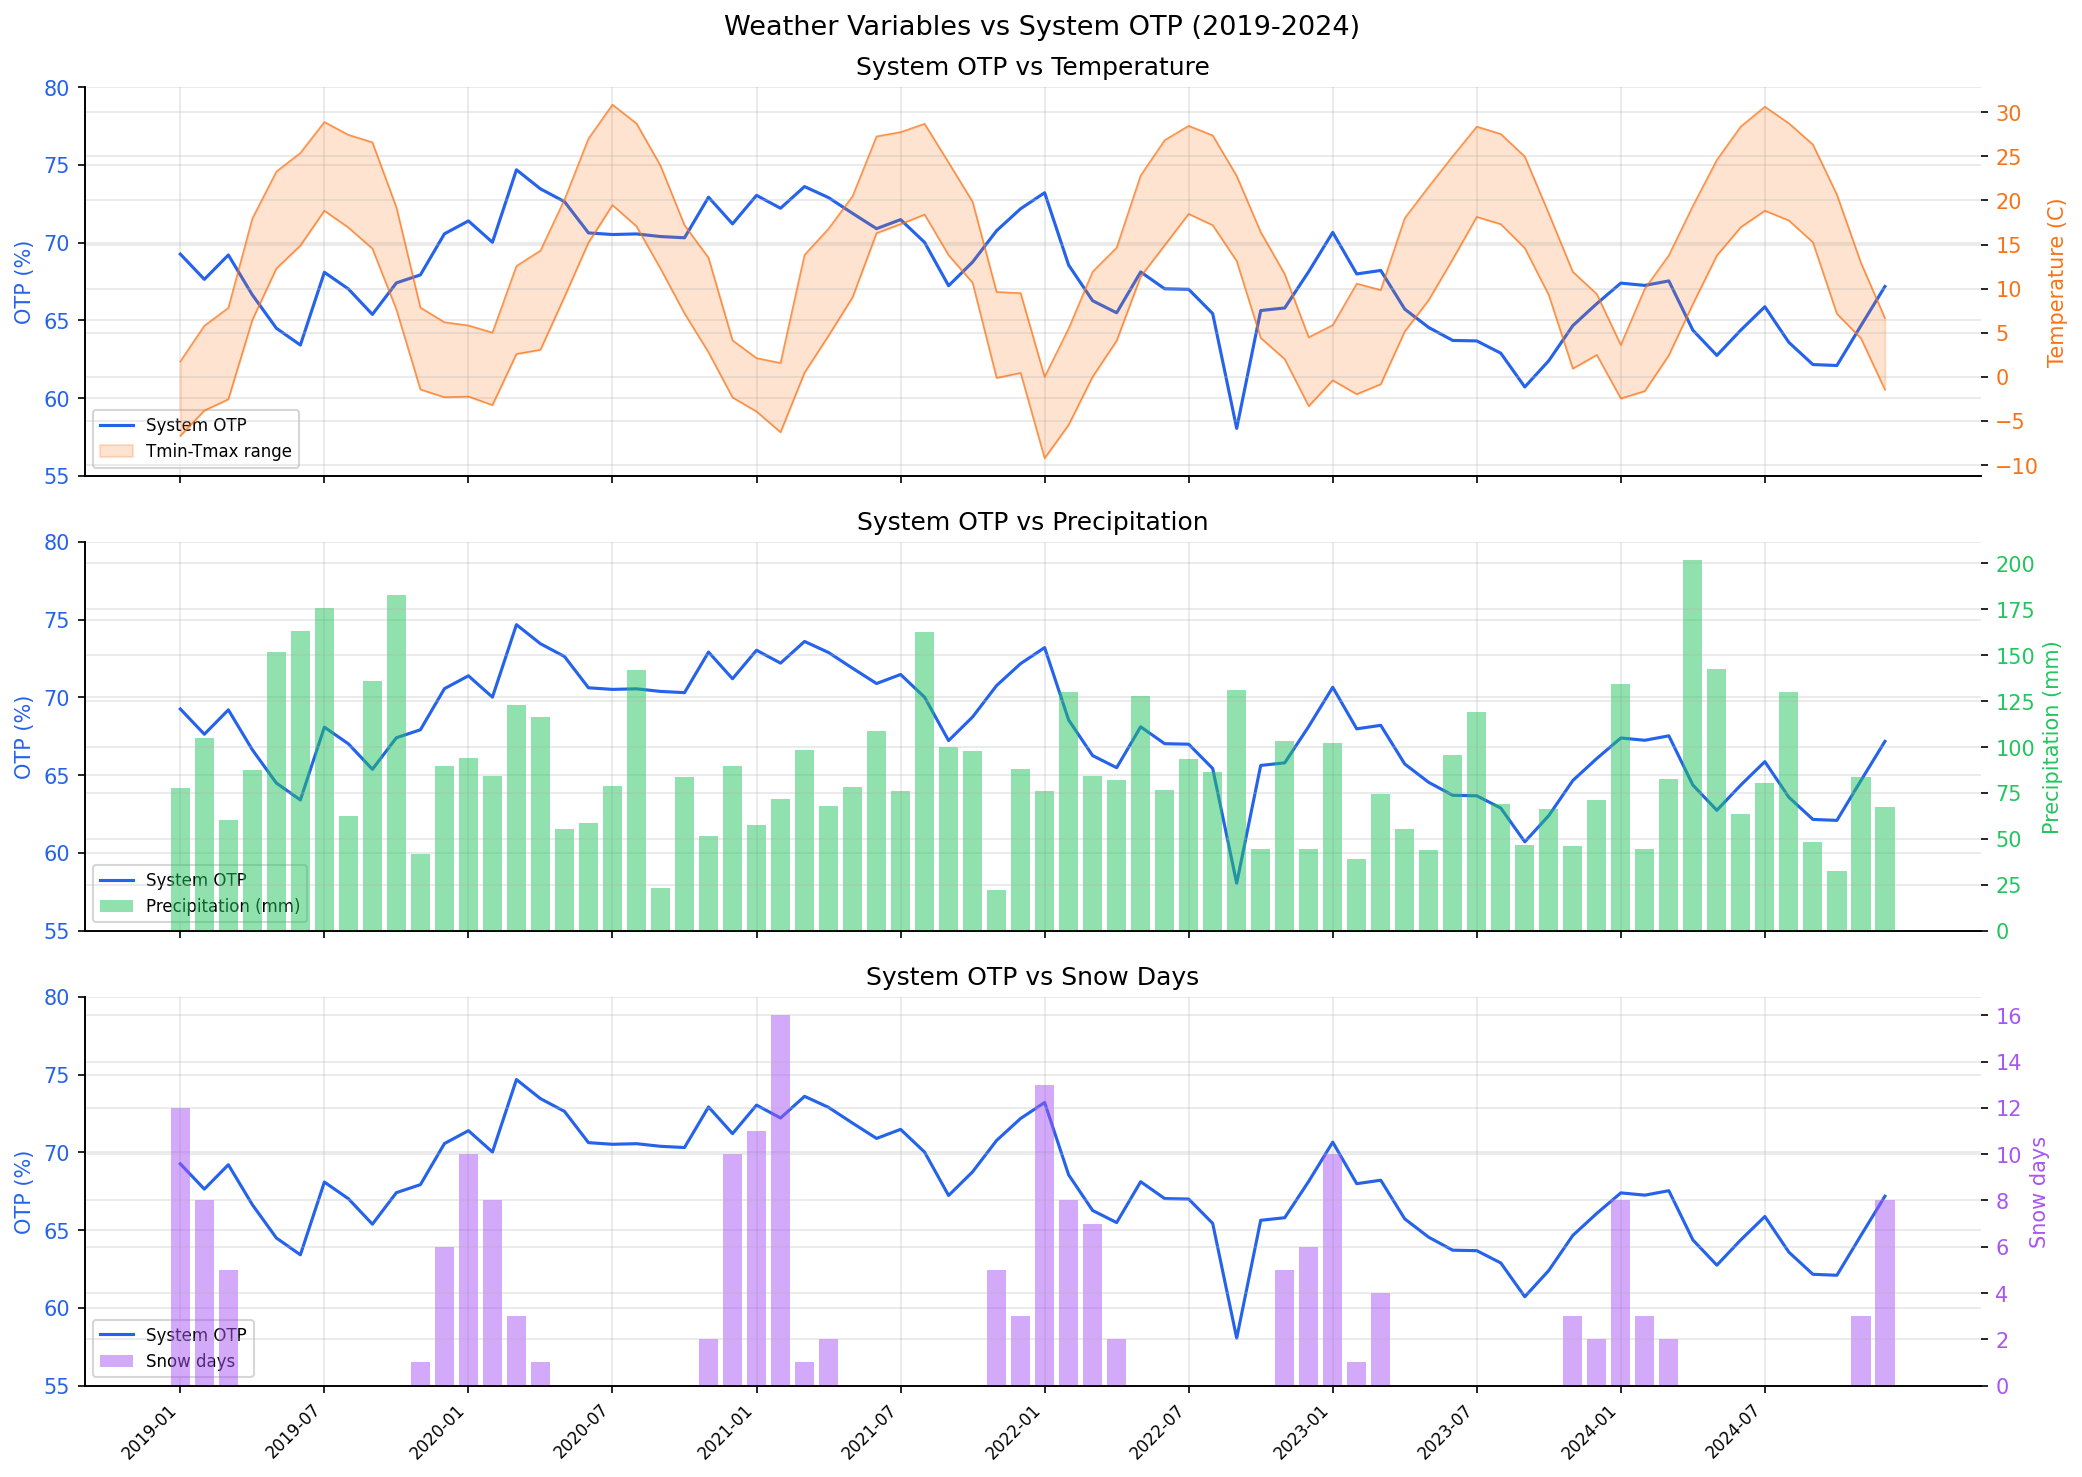
def chart_timeseries(merged: pl.DataFrame) -> None:
"""Chart 1: Weather time series overlaid with system OTP."""
plt = setup_plotting()
fig, axes = plt.subplots(3, 1, figsize=(14, 10), sharex=True)
months = merged["month"].to_list()
x = np.arange(len(months))
tick_step = max(1, len(months) // 12)
tick_idx = list(range(0, len(months), tick_step))
otp = merged["weighted_otp"].to_numpy() * 100
# Panel 1: Temperature + OTP
ax = axes[0]
ax.plot(x, otp, color="#2563eb", linewidth=1.5, label="System OTP")
ax.set_ylabel("OTP (%)", color="#2563eb")
ax.tick_params(axis="y", labelcolor="#2563eb")
ax.set_ylim(55, 80)
ax2 = ax.twinx()
tmax = merged["mean_tmax_c"].to_numpy()
tmin = merged["mean_tmin_c"].to_numpy()
ax2.fill_between(x, tmin, tmax, alpha=0.2, color="#f97316", label="Tmin-Tmax range")
ax2.plot(x, tmax, color="#f97316", linewidth=0.8, alpha=0.7)
ax2.plot(x, tmin, color="#f97316", linewidth=0.8, alpha=0.7)
ax2.set_ylabel("Temperature (C)", color="#f97316")
ax2.tick_params(axis="y", labelcolor="#f97316")
ax.set_title("System OTP vs Temperature")
lines1, labels1 = ax.get_legend_handles_labels()
lines2, labels2 = ax2.get_legend_handles_labels()
ax.legend(lines1 + lines2, labels1 + labels2, loc="lower left", fontsize=8)
# Panel 2: Precipitation + OTP
ax = axes[1]
ax.plot(x, otp, color="#2563eb", linewidth=1.5, label="System OTP")
ax.set_ylabel("OTP (%)", color="#2563eb")
ax.tick_params(axis="y", labelcolor="#2563eb")
ax.set_ylim(55, 80)
ax2 = ax.twinx()
precip = merged["total_precip_mm"].to_numpy()
ax2.bar(x, precip, width=0.8, color="#22c55e", alpha=0.5, label="Precipitation (mm)")
ax2.set_ylabel("Precipitation (mm)", color="#22c55e")
ax2.tick_params(axis="y", labelcolor="#22c55e")
ax.set_title("System OTP vs Precipitation")
lines1, labels1 = ax.get_legend_handles_labels()
lines2, labels2 = ax2.get_legend_handles_labels()
ax.legend(lines1 + lines2, labels1 + labels2, loc="lower left", fontsize=8)
# Panel 3: Snow + OTP
ax = axes[2]
ax.plot(x, otp, color="#2563eb", linewidth=1.5, label="System OTP")
ax.set_ylabel("OTP (%)", color="#2563eb")
ax.tick_params(axis="y", labelcolor="#2563eb")
ax.set_ylim(55, 80)
ax2 = ax.twinx()
snow = merged["snow_days"].to_numpy()
ax2.bar(x, snow, width=0.8, color="#a855f7", alpha=0.5, label="Snow days")
ax2.set_ylabel("Snow days", color="#a855f7")
ax2.tick_params(axis="y", labelcolor="#a855f7")
ax.set_title("System OTP vs Snow Days")
lines1, labels1 = ax.get_legend_handles_labels()
lines2, labels2 = ax2.get_legend_handles_labels()
ax.legend(lines1 + lines2, labels1 + labels2, loc="lower left", fontsize=8)
ax.set_xticks(tick_idx)
ax.set_xticklabels([months[i] for i in tick_idx], rotation=45, ha="right", fontsize=8)
fig.suptitle("Weather Variables vs System OTP (2019-2024)", fontsize=13)
save_chart(fig, OUT / "weather_otp_timeseries.png")
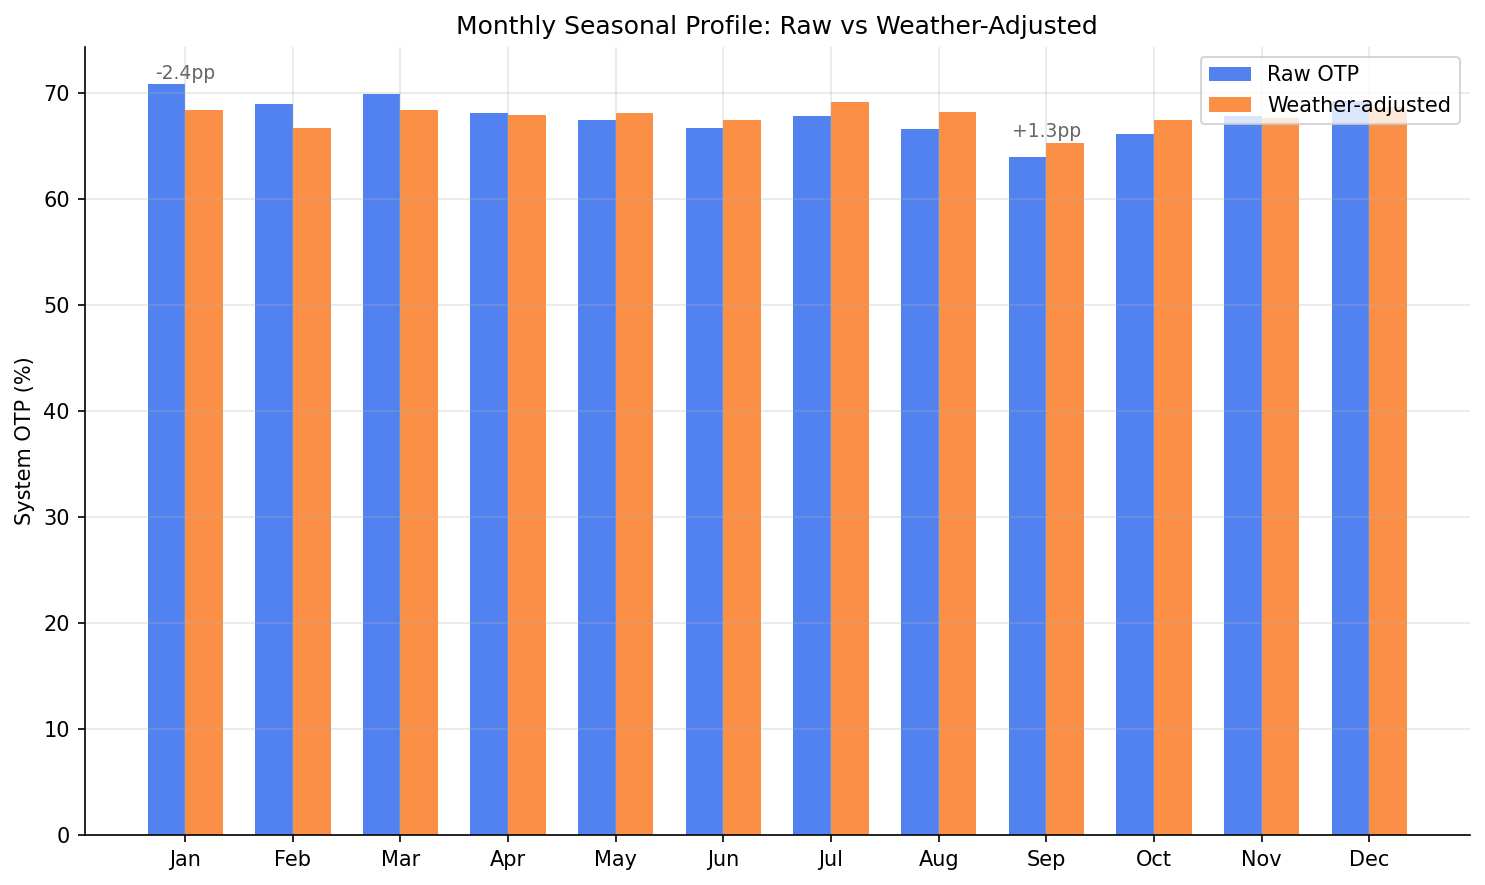
def chart_seasonal_adjusted(seasonal_raw: dict, seasonal_adj: dict) -> None:
"""Chart 2: Monthly seasonal profile -- actual vs weather-adjusted."""
plt = setup_plotting()
fig, ax = plt.subplots(figsize=(10, 6))
months = list(range(1, 13))
raw_vals = [seasonal_raw.get(m, float("nan")) * 100 for m in months]
adj_vals = [seasonal_adj.get(m, float("nan")) * 100 for m in months]
width = 0.35
x = np.arange(12)
ax.bar(x - width / 2, raw_vals, width, label="Raw OTP", color="#2563eb", alpha=0.8)
ax.bar(x + width / 2, adj_vals, width, label="Weather-adjusted", color="#f97316", alpha=0.8)
ax.set_xticks(x)
ax.set_xticklabels(MONTH_LABELS)
ax.set_ylabel("System OTP (%)")
ax.set_title("Monthly Seasonal Profile: Raw vs Weather-Adjusted")
ax.legend(fontsize=10)
# Annotate the difference for Sep and Jan
for m_idx, m in enumerate([0, 8]): # Jan=0, Sep=8
diff = adj_vals[m] - raw_vals[m]
y_pos = max(raw_vals[m], adj_vals[m]) + 0.5
ax.annotate(f"{diff:+.1f}pp", xy=(m, y_pos), ha="center", fontsize=9, color="#666")
save_chart(fig, OUT / "seasonal_weather_adjusted.png")
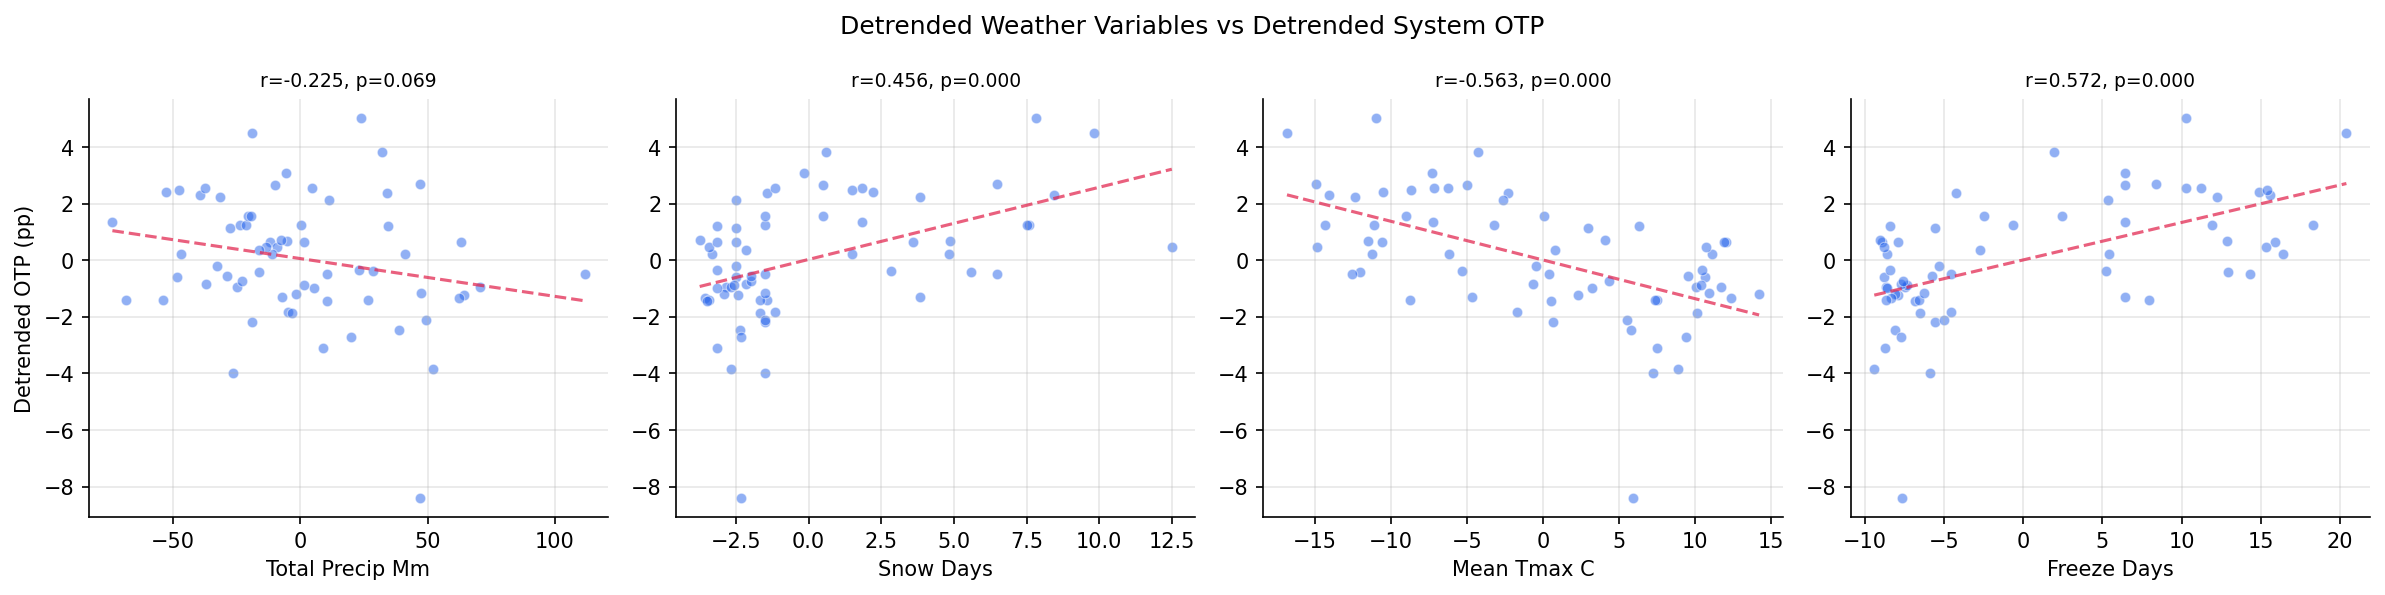
def chart_scatter_matrix(merged: pl.DataFrame) -> None:
"""Chart 3: Scatter matrix of key weather vars vs detrended system OTP."""
plt = setup_plotting()
key_vars = ["total_precip_mm", "snow_days", "mean_tmax_c", "freeze_days"]
n_vars = len(key_vars)
fig, axes = plt.subplots(1, n_vars, figsize=(16, 4))
dt = merged.filter(pl.col("otp_detrended").is_not_null())
otp_dt = dt["otp_detrended"].to_numpy() * 100
for i, var in enumerate(key_vars):
ax = axes[i]
dt_col = f"{var}_detrended"
if dt_col in dt.columns:
x = dt[dt_col].to_numpy().astype(float)
else:
x = dt[var].to_numpy().astype(float)
mask = ~np.isnan(x) & ~np.isnan(otp_dt)
ax.scatter(x[mask], otp_dt[mask], alpha=0.5, s=25, color="#2563eb", edgecolors="white", linewidth=0.5)
# Trend line
slope, intercept, r, p, _ = stats.linregress(x[mask], otp_dt[mask])
x_line = np.array([np.min(x[mask]), np.max(x[mask])])
ax.plot(x_line, slope * x_line + intercept, color="#e11d48", linewidth=1.5, linestyle="--", alpha=0.7)
ax.set_xlabel(var.replace("_", " ").title())
ax.set_title(f"r={r:.3f}, p={p:.3f}", fontsize=9)
if i == 0:
ax.set_ylabel("Detrended OTP (pp)")
fig.suptitle("Detrended Weather Variables vs Detrended System OTP", fontsize=12)
save_chart(fig, OUT / "weather_scatter_matrix.png")
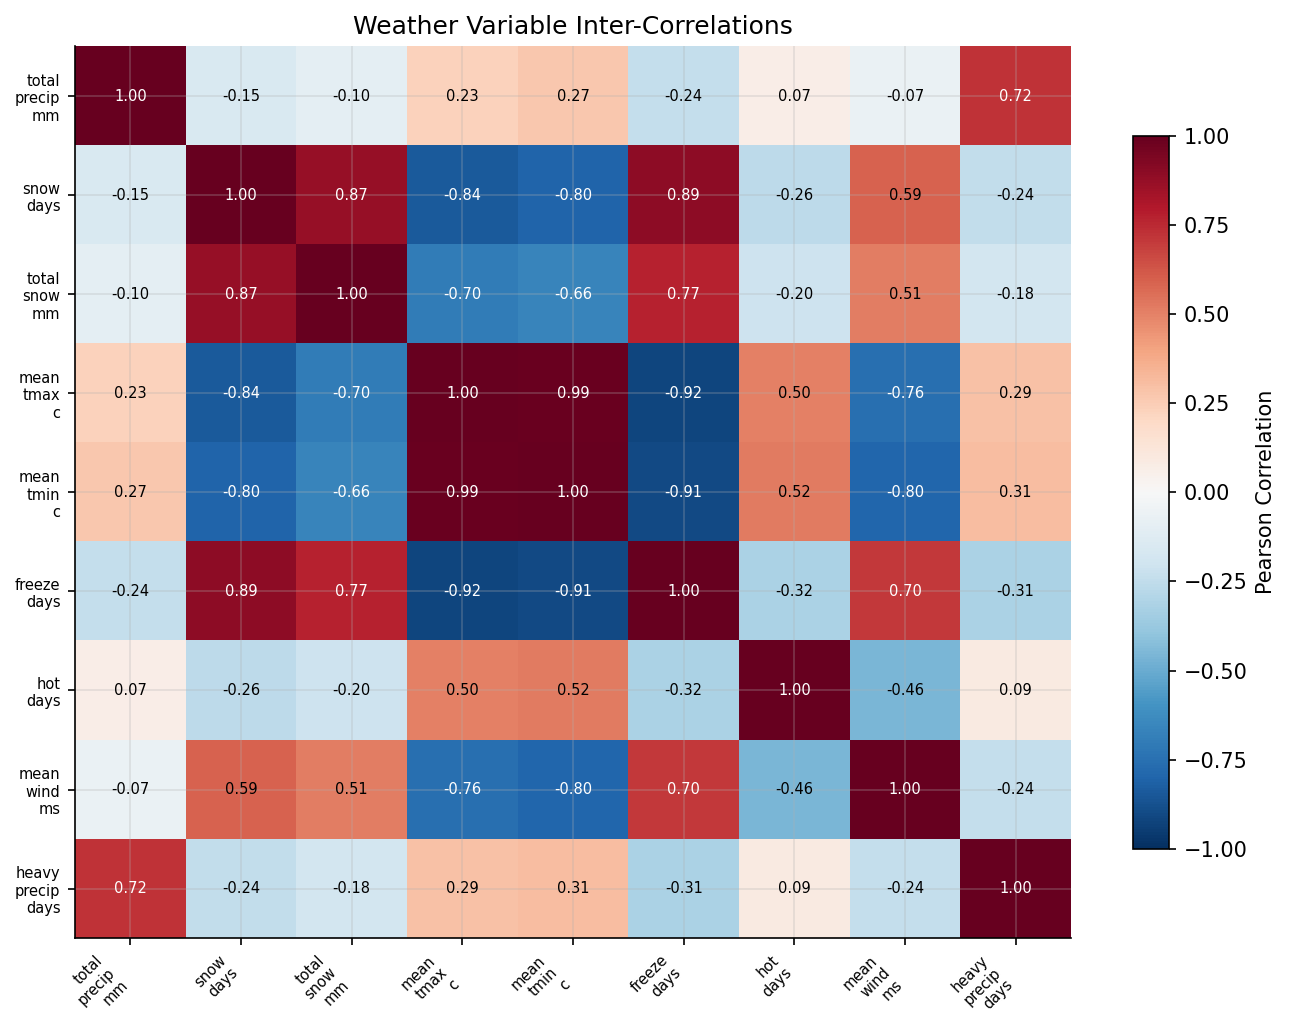
def chart_weather_heatmap(weather: pl.DataFrame) -> None:
"""Chart 4: Heatmap of weather variable inter-correlations."""
plt = setup_plotting()
fig, ax = plt.subplots(figsize=(9, 7))
data = np.column_stack([weather[v].to_numpy().astype(float) for v in WEATHER_VARS])
# Remove rows with any NaN
mask = ~np.any(np.isnan(data), axis=1)
data = data[mask]
n_vars = len(WEATHER_VARS)
corr_matrix = np.corrcoef(data, rowvar=False)
im = ax.imshow(corr_matrix, cmap="RdBu_r", vmin=-1, vmax=1, aspect="auto")
ax.set_xticks(range(n_vars))
ax.set_yticks(range(n_vars))
short_names = [v.replace("_", "\n") for v in WEATHER_VARS]
ax.set_xticklabels(short_names, fontsize=7, rotation=45, ha="right")
ax.set_yticklabels(short_names, fontsize=7)
# Annotate cells
for i in range(n_vars):
for j in range(n_vars):
val = corr_matrix[i, j]
color = "white" if abs(val) > 0.6 else "black"
ax.text(j, i, f"{val:.2f}", ha="center", va="center", fontsize=7, color=color)
fig.colorbar(im, ax=ax, label="Pearson Correlation", shrink=0.8)
ax.set_title("Weather Variable Inter-Correlations")
save_chart(fig, OUT / "weather_correlation_heatmap.png")
# ---------------------------------------------------------------------------
# Save model comparison CSV
# ---------------------------------------------------------------------------
def save_model_comparison(block_a_reg: dict, block_b_results: dict, block_c_results: dict) -> None:
"""Save all model results to a single CSV."""
rows = []
models = [
(block_b_results["model_month"], "month_only"),
(block_b_results["model_weather"], "weather_only"),
(block_b_results["model_both"], "month_plus_weather"),
(block_c_results["fe_model"], "panel_fixed_effects"),
]
for model, label in models:
for i, feat in enumerate(model["features"]):
rows.append({
"model": label,
"feature": feat,
"coefficient": model["coefficients"][i],
"std_error": model["std_errors"][i],
"p_value": model["p_values"][i],
"beta_weight": model["beta_weights"][i] if model["beta_weights"][i] is not None else float("nan"),
"r_squared": model["r_squared"],
"adj_r_squared": model["adj_r_squared"],
"n": model["n"],
})
save_csv(pl.DataFrame(rows), OUT / "model_comparison.csv")
# ---------------------------------------------------------------------------
# Main
# ---------------------------------------------------------------------------
@run_analysis(28, "Weather Impact on OTP")
def main() -> None:
"""Entry point: load data, run three analysis blocks, chart, and save."""
with phase("Loading data"):
system = load_system_otp()
weather = load_weather()
route_otp = load_route_otp()
print(f" System OTP: {len(system)} months")
print(f" Weather: {len(weather)} months")
print(f" Route OTP: {len(route_otp)} route-month observations")
# Block A: System-level correlations
merged = block_a(system, weather)
# Block B: Seasonal decomposition
block_b_results = block_b(merged)
# Block C: Route-level panel regression
block_c_results = block_c(route_otp, weather)
with phase("Generating charts"):
print("\n" + "=" * 60)
print("Charts")
print("=" * 60)
chart_timeseries(merged)
chart_seasonal_adjusted(block_b_results["seasonal_raw"], block_b_results["seasonal_adj"])
chart_scatter_matrix(merged)
chart_weather_heatmap(weather)
with phase("Saving CSVs"):
save_model_comparison(None, block_b_results, block_c_results)
if __name__ == "__main__":
main()
|