Analysis

02 - Mode Comparison

Core OTP Patterns

Coverage: 2019-01 to 2025-11 (from otp_monthly).

Built 2026-04-03 20:09 UTC · Commit 7c56b9a

Page Navigation

Analysis Navigation

Data Provenance

flowchart LR
  02_mode_comparison(["02 - Mode Comparison"])
  t_otp_monthly[("otp_monthly")] --> 02_mode_comparison
  01_data_ingestion[["Data Ingestion"]] --> t_otp_monthly
  u1_01_data_ingestion[/"data/routes_by_month.csv"/] --> 01_data_ingestion
  u2_01_data_ingestion[/"data/PRT_Current_Routes_Full_System_de0e48fcbed24ebc8b0d933e47b56682.csv"/] --> 01_data_ingestion
  u3_01_data_ingestion[/"data/Transit_stops_(current)_by_route_e040ee029227468ebf9d217402a82fa9.csv"/] --> 01_data_ingestion
  u4_01_data_ingestion[/"data/PRT_Stop_Reference_Lookup_Table.csv"/] --> 01_data_ingestion
  u5_01_data_ingestion[/"data/average-ridership/12bb84ed-397e-435c-8d1b-8ce543108698.csv"/] --> 01_data_ingestion
  t_route_stops[("route_stops")] --> 02_mode_comparison
  01_data_ingestion[["Data Ingestion"]] --> t_route_stops
  t_routes[("routes")] --> 02_mode_comparison
  01_data_ingestion[["Data Ingestion"]] --> t_routes
  d1_02_mode_comparison(("numpy (lib)")) --> 02_mode_comparison
  d2_02_mode_comparison(("polars (lib)")) --> 02_mode_comparison
  d3_02_mode_comparison(("scipy (lib)")) --> 02_mode_comparison
  classDef page fill:#dbeafe,stroke:#1d4ed8,color:#1e3a8a,stroke-width:2px;
  classDef table fill:#ecfeff,stroke:#0e7490,color:#164e63;
  classDef dep fill:#fff7ed,stroke:#c2410c,color:#7c2d12,stroke-dasharray: 4 2;
  classDef file fill:#eef2ff,stroke:#6366f1,color:#3730a3;
  classDef api fill:#f0fdf4,stroke:#16a34a,color:#14532d;
  classDef pipeline fill:#f5f3ff,stroke:#7c3aed,color:#4c1d95;
  class 02_mode_comparison page;
  class t_otp_monthly,t_route_stops,t_routes table;
  class d1_02_mode_comparison,d2_02_mode_comparison,d3_02_mode_comparison dep;
  class u1_01_data_ingestion,u2_01_data_ingestion,u3_01_data_ingestion,u4_01_data_ingestion,u5_01_data_ingestion file;
  class 01_data_ingestion pipeline;

Findings

Findings: Mode Comparison

Summary

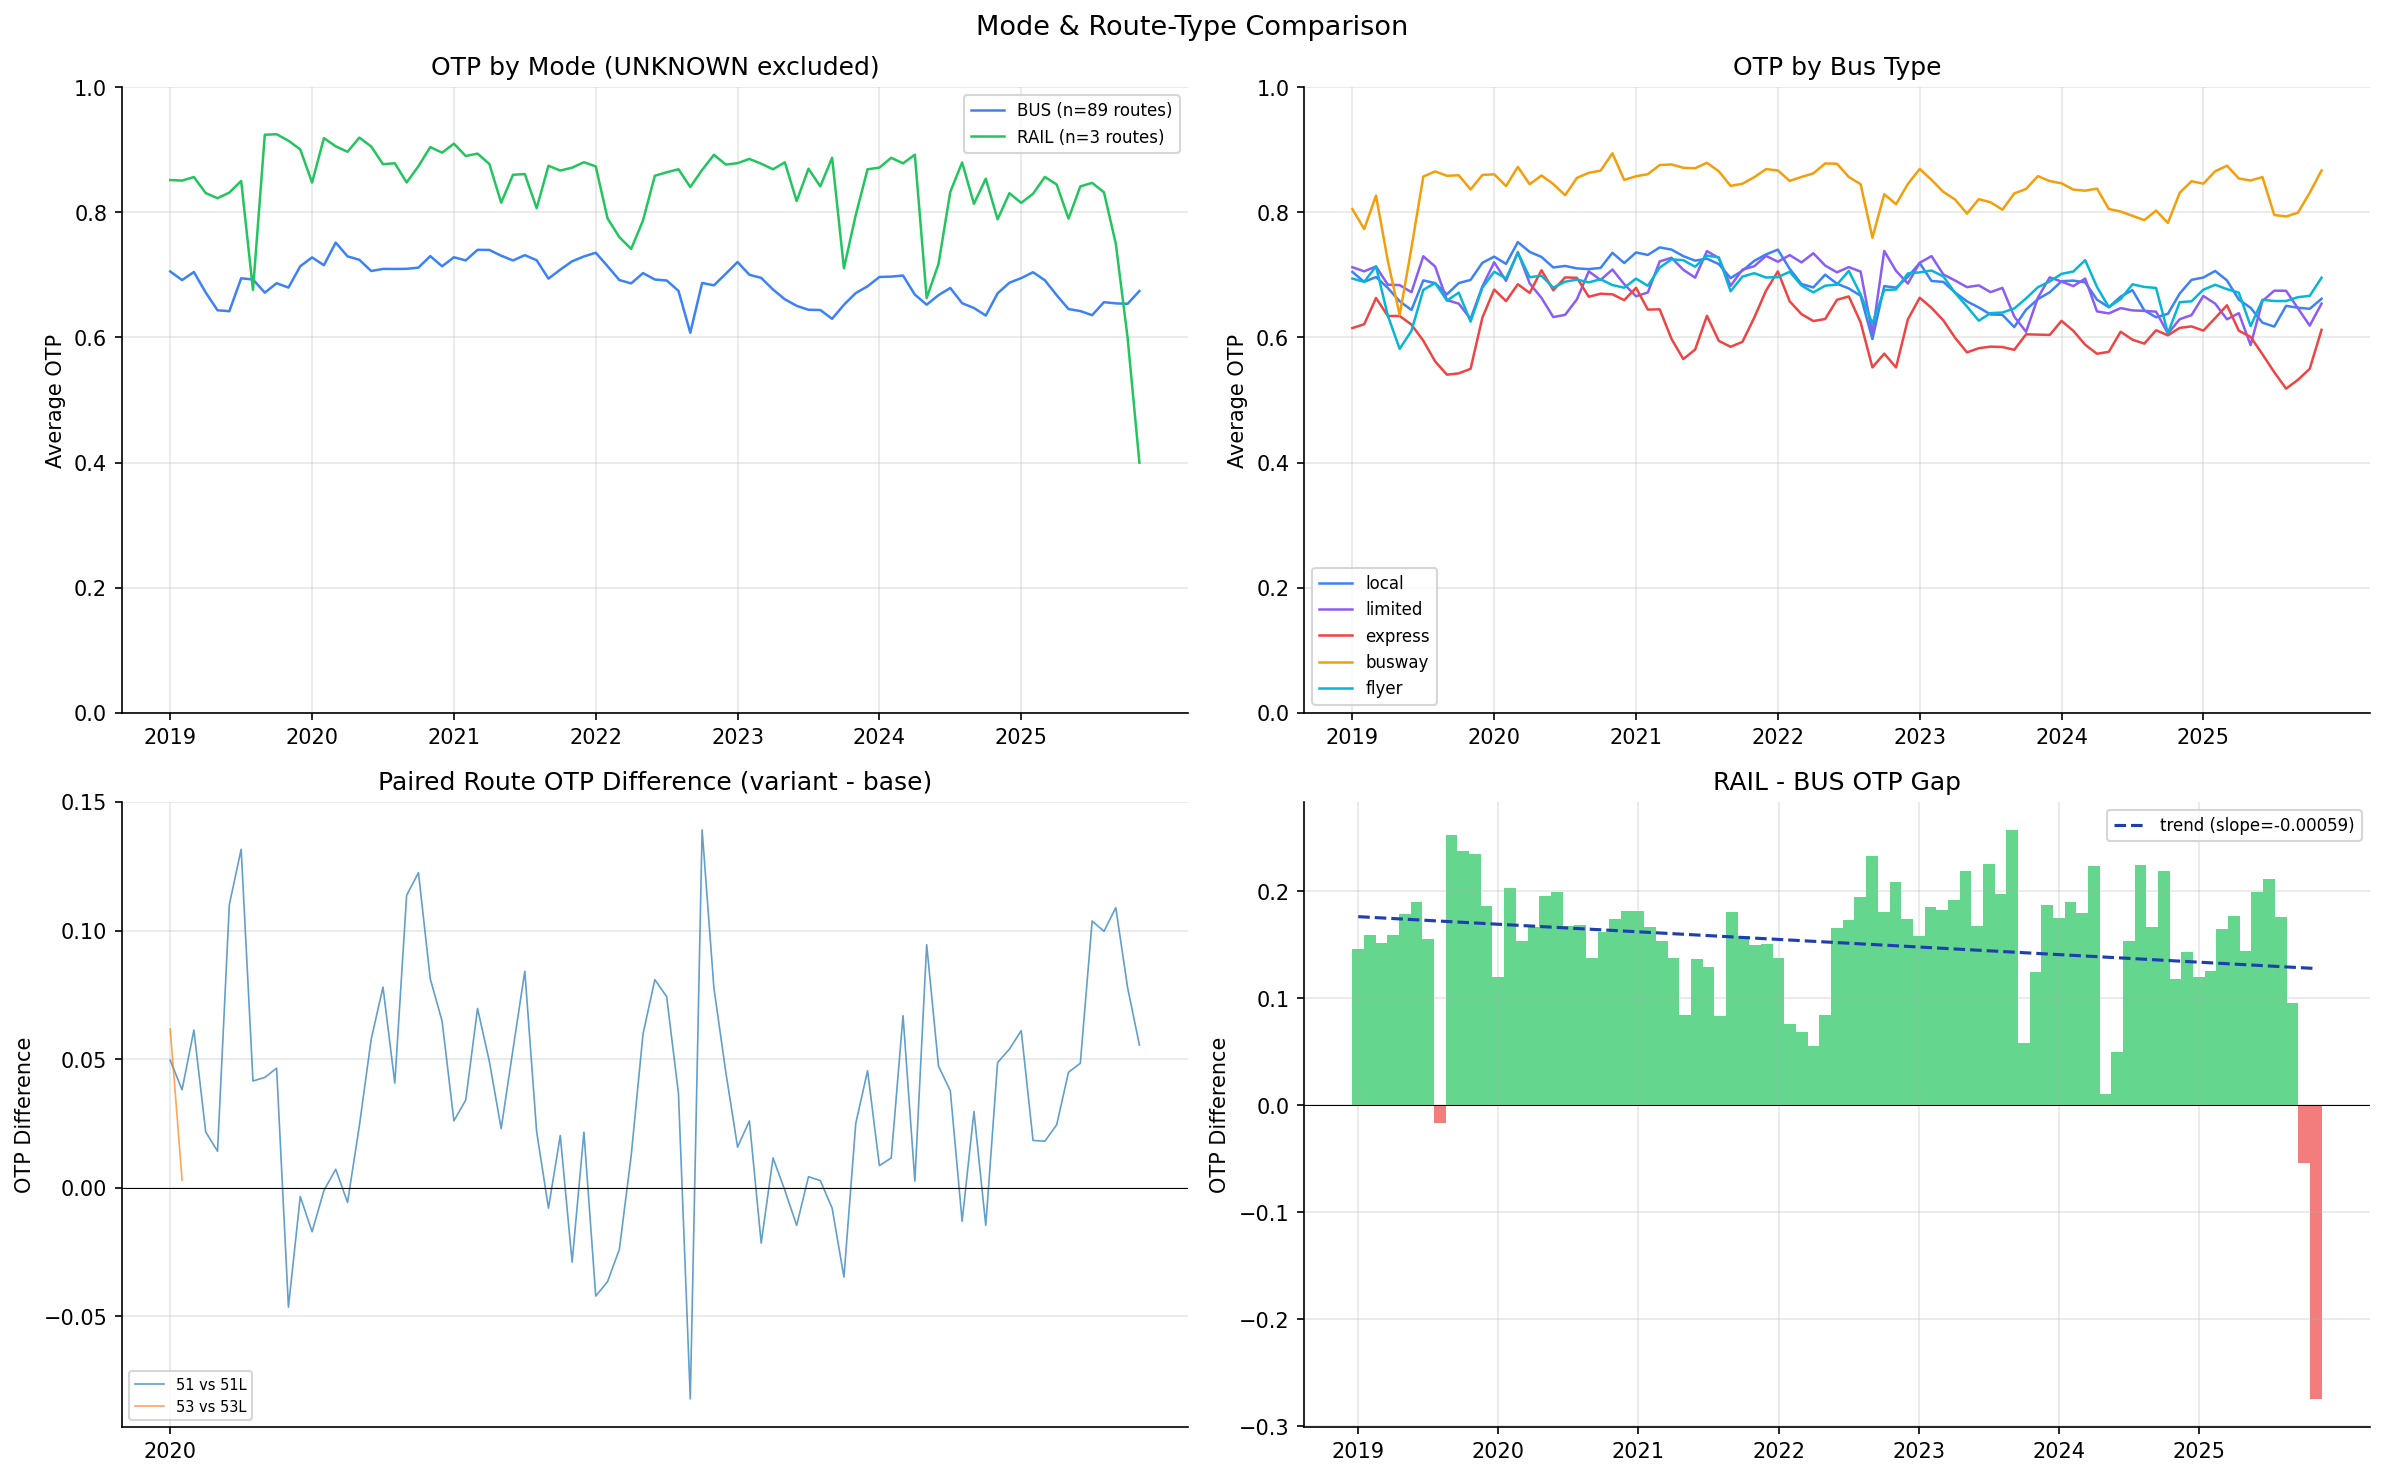
Light rail consistently outperforms bus by a wide margin, and the difference is statistically significant (Mann-Whitney U = 6,563, p < 0.001). Among bus routes, dedicated right-of-way (busway) routes perform nearly as well as rail, and limited-stop variants beat their local counterparts.

Key Numbers

Mode / Type Avg OTP (unweighted) Avg OTP (trip-weighted) Route Count
RAIL 84% 84% 3
Busway (P1, P3, G2) 71--76% -- 3
Flyer (P/G/O prefix) ~70% -- ~16
Limited (L suffix) ~72% -- varies
Express (X suffix) ~70% -- varies
Local bus 63--69% -- ~60

Statistical Tests

  • Mann-Whitney U test (RAIL vs BUS monthly OTP): U = 6,563, p < 0.001 (n = 83 months each). Rail median monthly OTP = 86.1%, bus median = 69.2%. The difference is highly significant.
  • Paired route comparison (2 pairs: 51/51L, 53/53L): Limited variants average +3.5 percentage points over their local counterparts (paired t-test: t = 7.37, p < 0.001, 95% CI: [+2.5, +4.4 pp], n = 85 paired monthly observations across 2 pairs). While the test is significant, the sample of only 2 route pairs limits the generalizability of this finding.
  • Trip-weighted mode average: Bus trip-weighted OTP (66.8%) is about 2 pp below the unweighted average (68.9%), confirming that high-frequency bus routes tend to perform worse. Rail is nearly the same weighted (83.8%) vs unweighted (84.1%).

Observations

  • Busway routes (P1, P3, G2) perform nearly as well as rail, consistent with the dedicated-right-of-way hypothesis.
  • The previous classification grouped all P/G-prefix routes as "busway," which incorrectly included flyer routes like P17 (Lincoln Park Flyer), P78 (Oakmont Flyer), G3 (Moon Flyer), and G31 (Bridgeville Flyer). The corrected classification identifies only P1, P2, P3, and G2 as true busway routes.
  • Only 2 local/limited pairs were found in the data (routes with matching base IDs). More pairs would strengthen the comparison.
  • The RAIL--BUS gap has been roughly stable over time -- both modes declined in parallel, suggesting system-wide factors rather than mode-specific ones.
  • The INCLINE mode has no OTP data and was excluded.

Caveats

  • Five UNKNOWN-mode routes (37, 42, P2, RLSH, SWL) were excluded from the analysis. P2 (East Busway Short) is plausibly a BUS/busway route, but its mode is listed as UNKNOWN in the database and it also lacks route_stops data.
  • Bus route classification uses route ID naming conventions. True busway routes are identified as P1, P2, P3, G2; all other P/G/O-prefix routes are classified as flyers. Some routes may still be misclassified if their ID doesn't follow the standard pattern.
  • Rail has only 3 routes (RED, BLUE, SLVR), so its average is sensitive to any single route's performance. The Mann-Whitney test has adequate statistical power due to 83 months of observations, but the underlying data comes from only 3 routes.
  • The mode-level unweighted average treats each route equally regardless of trip volume. The trip-weighted version provides a ridership-adjusted perspective.
  • Route composition varies across months (68--96 routes reporting). No balanced-panel filter is applied, so the set of routes contributing to each month's average is not fixed.

Review History

Output

Methods

Methods: Mode Comparison

Question

Does light rail (dedicated right-of-way) consistently outperform bus? Do limited/express routes beat their local counterparts?

Approach

  • Exclude UNKNOWN-mode routes (37, 42, P2, RLSH, SWL) from the analysis to avoid ambiguous classifications.
  • Group routes by mode (BUS, RAIL) and compute average OTP per mode per month, both unweighted and trip-weighted (using trips_7d from route_stops).
  • Perform a Mann-Whitney U test on the monthly mode-level OTP distributions to formally test whether the RAIL--BUS difference is statistically significant.
  • Classify bus routes by type using route ID patterns:
    • Busway: P1, P2, P3, G2 (dedicated right-of-way)
    • Flyer: Other P/G-prefix routes (e.g., P17, P78, G3, G31) and O-prefix routes (park-and-ride express services)
    • Limited: L-suffix routes (e.g., 51L, 53L)
    • Express: X-suffix routes
    • Local: All other bus routes
  • Compare paired routes sharing the same corridor (e.g. 51 vs 51L) as natural experiments. Perform a paired t-test on monthly OTP differences and report the mean difference with a 95% confidence interval.
  • Test whether the mode gap changes over time.

Data

Name Description Source
otp_monthly Monthly OTP per route prt.db table
routes Mode classification (filter out UNKNOWN) prt.db table
route_stops Trip counts for trip-weighted mode averages prt.db table

Output

  • output/mode_comparison.csv -- monthly OTP by mode/type (unweighted)
  • output/mode_comparison_weighted.csv -- monthly OTP by mode (trip-weighted)
  • output/mode_comparison.png -- comparison chart

Source Code

"""Mode and route-type comparison: BUS vs RAIL, local vs limited vs express, with statistical tests."""

import polars as pl
from scipy.stats import mannwhitneyu, ttest_rel

from prt_otp_analysis.common import (
    BUS_TYPE_COLORS,
    CONFIDENCE_95_PERCENTILE,
    MODE_COLORS,
    analysis_dir,
    classify_bus_route,
    phase,
    query_to_polars,
    run_analysis,
    save_chart,
    save_csv,
    setup_plotting,
    weighted_mean,
)

OUT = analysis_dir(__file__)


def load_data() -> pl.DataFrame:
    """Load OTP data with route metadata, excluding UNKNOWN-mode routes."""
    return query_to_polars("""
        SELECT o.route_id, o.month, o.otp, r.route_name, r.mode,
               COALESCE(rs_agg.trips_7d, 0) AS trips_7d
        FROM otp_monthly o
        JOIN routes r ON o.route_id = r.route_id
        LEFT JOIN (
            SELECT route_id, SUM(trips_7d) AS trips_7d
            FROM route_stops
            GROUP BY route_id
        ) rs_agg ON o.route_id = rs_agg.route_id
        WHERE r.mode != 'UNKNOWN'
    """)


def analyze(df: pl.DataFrame) -> tuple[pl.DataFrame, pl.DataFrame, pl.DataFrame, pl.DataFrame, dict]:
    """Compute OTP by mode, by bus subtype, paired-route comparisons, and statistical tests."""
    # Classify bus routes
    df = df.with_columns(
        bus_type=pl.when(pl.col("mode") == "BUS")
        .then(pl.col("route_id").map_elements(classify_bus_route, return_dtype=pl.String))
        .otherwise(pl.lit(None)),
    )

    # Mode-level monthly OTP (unweighted)
    mode_monthly = (
        df.group_by(["mode", "month"])
        .agg(
            avg_otp=pl.col("otp").mean(),
            route_count=pl.col("route_id").n_unique(),
        )
        .sort(["mode", "month"])
    )

    # Mode-level monthly OTP (trip-weighted)
    mode_monthly_weighted = (
        df.group_by(["mode", "month"])
        .agg(
            weighted_otp=weighted_mean("otp", "trips_7d", safe=True),
            route_count=pl.col("route_id").n_unique(),
        )
        .sort(["mode", "month"])
    )

    # Bus-subtype monthly OTP
    bus_monthly = (
        df.filter(pl.col("mode") == "BUS")
        .group_by(["bus_type", "month"])
        .agg(avg_otp=pl.col("otp").mean(), route_count=pl.col("route_id").n_unique())
        .sort(["bus_type", "month"])
    )

    # Paired route comparison: find base routes with L/X counterparts
    route_ids = df["route_id"].unique().to_list()
    pairs = []
    for rid in route_ids:
        if rid.endswith("L") and rid[:-1] in route_ids:
            pairs.append((rid[:-1], rid, "local-vs-limited"))
        elif rid.endswith("X") and rid[:-1] in route_ids:
            pairs.append((rid[:-1], rid, "local-vs-express"))

    pair_rows = []
    for base_id, variant_id, pair_type in pairs:
        base = df.filter(pl.col("route_id") == base_id).select("month", otp_base=pl.col("otp"))
        variant = df.filter(pl.col("route_id") == variant_id).select("month", otp_variant=pl.col("otp"))
        joined = base.join(variant, on="month")
        if len(joined) > 0:
            joined = joined.with_columns(
                base_id=pl.lit(base_id),
                variant_id=pl.lit(variant_id),
                pair_type=pl.lit(pair_type),
                otp_diff=pl.col("otp_variant") - pl.col("otp_base"),
            )
            pair_rows.append(joined)

    paired = pl.concat(pair_rows) if pair_rows else pl.DataFrame()

    # --- Statistical tests ---
    test_results = {}

    # Mann-Whitney U test: bus vs rail monthly OTP distributions
    bus_monthly_otp = mode_monthly.filter(pl.col("mode") == "BUS")["avg_otp"].to_list()
    rail_monthly_otp = mode_monthly.filter(pl.col("mode") == "RAIL")["avg_otp"].to_list()
    if len(bus_monthly_otp) > 0 and len(rail_monthly_otp) > 0:
        u_stat, u_pval = mannwhitneyu(rail_monthly_otp, bus_monthly_otp, alternative="two-sided")
        test_results["mann_whitney_u"] = u_stat
        test_results["mann_whitney_p"] = u_pval
        test_results["bus_n_months"] = len(bus_monthly_otp)
        test_results["rail_n_months"] = len(rail_monthly_otp)
        test_results["bus_median_otp"] = sorted(bus_monthly_otp)[len(bus_monthly_otp) // 2]
        test_results["rail_median_otp"] = sorted(rail_monthly_otp)[len(rail_monthly_otp) // 2]

    # Paired t-test for local vs limited route pairs
    if len(paired) > 0:
        pair_labels = paired.select("base_id", "variant_id").unique()
        pair_means = []
        for row in pair_labels.iter_rows(named=True):
            pair_data = paired.filter(
                (pl.col("base_id") == row["base_id"]) & (pl.col("variant_id") == row["variant_id"])
            )
            pair_means.append(pair_data["otp_diff"].mean())

        test_results["n_pairs"] = len(pair_means)
        test_results["pair_mean_diff"] = sum(pair_means) / len(pair_means) if pair_means else 0

        # Paired t-test on per-month differences across all pairs combined
        # For each pair, collect the per-month OTP differences
        all_base_otp = []
        all_variant_otp = []
        for row in pair_labels.iter_rows(named=True):
            pair_data = paired.filter(
                (pl.col("base_id") == row["base_id"]) & (pl.col("variant_id") == row["variant_id"])
            )
            all_base_otp.extend(pair_data["otp_base"].to_list())
            all_variant_otp.extend(pair_data["otp_variant"].to_list())

        if len(all_base_otp) >= 2:
            t_stat, t_pval = ttest_rel(all_variant_otp, all_base_otp)
            import numpy as np
            diffs = [v - b for v, b in zip(all_variant_otp, all_base_otp)]
            n = len(diffs)
            mean_diff = np.mean(diffs)
            se_diff = np.std(diffs, ddof=1) / np.sqrt(n)
            from scipy.stats import t as t_dist
            ci_margin = t_dist.ppf(CONFIDENCE_95_PERCENTILE, df=n - 1) * se_diff
            test_results["paired_t_stat"] = t_stat
            test_results["paired_t_pval"] = t_pval
            test_results["paired_mean_diff"] = mean_diff
            test_results["paired_ci_lower"] = mean_diff - ci_margin
            test_results["paired_ci_upper"] = mean_diff + ci_margin
            test_results["paired_n_obs"] = n

    # Trip-weighted mode averages
    for mode in ["BUS", "RAIL"]:
        data = mode_monthly_weighted.filter(pl.col("mode") == mode)
        if len(data) > 0:
            test_results[f"{mode.lower()}_weighted_avg"] = data["weighted_otp"].mean()

    return mode_monthly, bus_monthly, paired, mode_monthly_weighted, test_results


def make_chart(
    mode_monthly: pl.DataFrame,
    bus_monthly: pl.DataFrame,
    paired: pl.DataFrame,
) -> None:
    """Generate a 4-panel mode comparison chart."""
    plt = setup_plotting()
    fig, axes = plt.subplots(2, 2, figsize=(16, 10))


    # Top-left: Mode time series
    ax = axes[0, 0]
    for mode in ["BUS", "RAIL"]:
        data = mode_monthly.filter(pl.col("mode") == mode).sort("month")
        if len(data) == 0:
            continue
        months = data["month"].to_list()
        vals = data["avg_otp"].to_list()
        n_routes = int(data["route_count"].median())
        ax.plot(range(len(months)), vals, color=MODE_COLORS[mode], linewidth=1.2,
                label=f"{mode} (n={n_routes} routes)")
        tick_pos = [i for i, m in enumerate(months) if m.endswith("-01")]
        tick_lbl = [months[i][:4] for i in tick_pos]
        ax.set_xticks(tick_pos)
        ax.set_xticklabels(tick_lbl)
    ax.set_title("OTP by Mode (UNKNOWN excluded)")
    ax.set_ylabel("Average OTP")
    ax.legend(fontsize=8)
    ax.set_ylim(0, 1)

    # Top-right: Bus subtype time series
    ax = axes[0, 1]
    for btype in ["local", "limited", "express", "busway", "flyer"]:
        data = bus_monthly.filter(pl.col("bus_type") == btype).sort("month")
        if len(data) == 0:
            continue
        months = data["month"].to_list()
        vals = data["avg_otp"].to_list()
        ax.plot(range(len(months)), vals, color=BUS_TYPE_COLORS[btype], linewidth=1.2, label=btype)
        tick_pos = [i for i, m in enumerate(months) if m.endswith("-01")]
        tick_lbl = [months[i][:4] for i in tick_pos]
        ax.set_xticks(tick_pos)
        ax.set_xticklabels(tick_lbl)
    ax.set_title("OTP by Bus Type")
    ax.set_ylabel("Average OTP")
    ax.legend(fontsize=8)
    ax.set_ylim(0, 1)

    # Bottom-left: Paired route comparison
    ax = axes[1, 0]
    if len(paired) > 0:
        pair_labels = paired.select("base_id", "variant_id").unique()
        for row in pair_labels.iter_rows(named=True):
            pair_data = paired.filter(
                (pl.col("base_id") == row["base_id"]) & (pl.col("variant_id") == row["variant_id"])
            ).sort("month")
            months = pair_data["month"].to_list()
            diffs = pair_data["otp_diff"].to_list()
            ax.plot(range(len(months)), diffs, linewidth=0.8, alpha=0.7,
                    label=f"{row['base_id']} vs {row['variant_id']}")
            tick_pos = [i for i, m in enumerate(months) if m.endswith("-01")]
            tick_lbl = [months[i][:4] for i in tick_pos]
            ax.set_xticks(tick_pos)
            ax.set_xticklabels(tick_lbl)
        ax.axhline(0, color="black", linewidth=0.5)
        ax.legend(fontsize=7, loc="lower left")
    ax.set_title("Paired Route OTP Difference (variant - base)")
    ax.set_ylabel("OTP Difference")

    # Bottom-right: Mode gap over time (RAIL - BUS)
    ax = axes[1, 1]
    rail = mode_monthly.filter(pl.col("mode") == "RAIL").select("month", rail_otp=pl.col("avg_otp"))
    bus = mode_monthly.filter(pl.col("mode") == "BUS").select("month", bus_otp=pl.col("avg_otp"))
    gap = rail.join(bus, on="month").sort("month")
    if len(gap) > 0:
        gap = gap.with_columns(gap_val=pl.col("rail_otp") - pl.col("bus_otp"))
        months = gap["month"].to_list()
        gap_vals = gap["gap_val"].to_list()
        x = list(range(len(months)))
        colors = ["#22c55e" if v >= 0 else "#ef4444" for v in gap_vals]
        ax.bar(x, gap_vals, color=colors, width=1.0, alpha=0.7)
        ax.axhline(0, color="black", linewidth=0.5)

        # Trend line
        n = len(x)
        x_mean = sum(x) / n
        y_mean = sum(gap_vals) / n
        cov_xy = sum((xi - x_mean) * (yi - y_mean) for xi, yi in zip(x, gap_vals)) / n
        var_x = sum((xi - x_mean) ** 2 for xi in x) / n
        if var_x > 0:
            slope = cov_xy / var_x
            intercept = y_mean - slope * x_mean
            trend = [slope * xi + intercept for xi in x]
            ax.plot(x, trend, color="#1e40af", linewidth=1.5, linestyle="--", label=f"trend (slope={slope:.5f})")
            ax.legend(fontsize=8)

        tick_pos = [i for i, m in enumerate(months) if m.endswith("-01")]
        tick_lbl = [months[i][:4] for i in tick_pos]
        ax.set_xticks(tick_pos)
        ax.set_xticklabels(tick_lbl)
    ax.set_title("RAIL - BUS OTP Gap")
    ax.set_ylabel("OTP Difference")

    fig.suptitle("Mode & Route-Type Comparison", fontsize=13)
    save_chart(fig, OUT / "mode_comparison.png")


@run_analysis(2, "Mode Comparison")
def main() -> None:
    """Entry point: load data, analyze, chart, and save."""
    with phase("Loading data"):
        df = load_data()
        print(f"  {len(df):,} OTP observations loaded")

    with phase("Analyzing"):
        mode_monthly, bus_monthly, paired, mode_monthly_weighted, test_results = analyze(df)

        # Summary
        for mode in ["BUS", "RAIL"]:
            data = mode_monthly.filter(pl.col("mode") == mode)
            if len(data) > 0:
                avg = data["avg_otp"].mean()
                print(f"  {mode}: overall avg OTP (unweighted) = {avg:.1%}")
            w_key = f"{mode.lower()}_weighted_avg"
            if w_key in test_results:
                print(f"  {mode}: overall avg OTP (trip-weighted) = {test_results[w_key]:.1%}")

        # Mann-Whitney test
        if "mann_whitney_u" in test_results:
            print(f"\n  Mann-Whitney U test (RAIL vs BUS monthly OTP):")
            print(f"    U = {test_results['mann_whitney_u']:.1f}, p = {test_results['mann_whitney_p']:.2e}")
            print(f"    RAIL median = {test_results['rail_median_otp']:.1%}, BUS median = {test_results['bus_median_otp']:.1%}")

        if len(paired) > 0:
            avg_diff = paired["otp_diff"].mean()
            print(f"\n  Paired routes: avg OTP diff (variant - base) = {avg_diff:+.4f}")
            print(f"  {paired.select('base_id', 'variant_id').unique().height} route pairs found")

            if "paired_t_stat" in test_results:
                print(f"  Paired t-test on monthly OTP differences:")
                print(f"    t = {test_results['paired_t_stat']:.3f}, p = {test_results['paired_t_pval']:.4f}")
                print(f"    Mean diff = {test_results['paired_mean_diff']:.4f}")
                print(f"    95% CI: [{test_results['paired_ci_lower']:.4f}, {test_results['paired_ci_upper']:.4f}]")
                print(f"    n = {test_results['paired_n_obs']} paired observations across {test_results['n_pairs']} pairs")

    with phase("Saving CSV"):
        # Combine mode and bus type data for CSV
        csv_data = pl.concat([
            mode_monthly.with_columns(bus_type=pl.lit(None, dtype=pl.String)),
            bus_monthly.with_columns(mode=pl.lit("BUS")),
        ], how="diagonal")
        save_csv(csv_data, OUT / "mode_comparison.csv")

        # Save weighted mode data
        save_csv(mode_monthly_weighted, OUT / "mode_comparison_weighted.csv")

    with phase("Generating chart"):
        make_chart(mode_monthly, bus_monthly, paired)


if __name__ == "__main__":
    main()

Sources

NameTypeWhy It MattersOwnerFreshnessCaveat
otp_monthly table Primary analytical table used in this page's computations. Produced by Data Ingestion. Updated when the producing pipeline step is rerun. Coverage depends on upstream source availability and ETL assumptions.
Upstream sources (5)
  • file data/routes_by_month.csv — Monthly route OTP source table in wide format.
  • file data/PRT_Current_Routes_Full_System_de0e48fcbed24ebc8b0d933e47b56682.csv — Current route metadata and mode classifications.
  • file data/Transit_stops_(current)_by_route_e040ee029227468ebf9d217402a82fa9.csv — Current stop-to-route coverage and trip counts.
  • file data/PRT_Stop_Reference_Lookup_Table.csv — Historical stop reference file with geography attributes.
  • file data/average-ridership/12bb84ed-397e-435c-8d1b-8ce543108698.csv — Average ridership by route and month.
route_stops table Primary analytical table used in this page's computations. Produced by Data Ingestion. Updated when the producing pipeline step is rerun. Coverage depends on upstream source availability and ETL assumptions.
Upstream sources (5)
  • file data/routes_by_month.csv — Monthly route OTP source table in wide format.
  • file data/PRT_Current_Routes_Full_System_de0e48fcbed24ebc8b0d933e47b56682.csv — Current route metadata and mode classifications.
  • file data/Transit_stops_(current)_by_route_e040ee029227468ebf9d217402a82fa9.csv — Current stop-to-route coverage and trip counts.
  • file data/PRT_Stop_Reference_Lookup_Table.csv — Historical stop reference file with geography attributes.
  • file data/average-ridership/12bb84ed-397e-435c-8d1b-8ce543108698.csv — Average ridership by route and month.
routes table Primary analytical table used in this page's computations. Produced by Data Ingestion. Updated when the producing pipeline step is rerun. Coverage depends on upstream source availability and ETL assumptions.
Upstream sources (5)
  • file data/routes_by_month.csv — Monthly route OTP source table in wide format.
  • file data/PRT_Current_Routes_Full_System_de0e48fcbed24ebc8b0d933e47b56682.csv — Current route metadata and mode classifications.
  • file data/Transit_stops_(current)_by_route_e040ee029227468ebf9d217402a82fa9.csv — Current stop-to-route coverage and trip counts.
  • file data/PRT_Stop_Reference_Lookup_Table.csv — Historical stop reference file with geography attributes.
  • file data/average-ridership/12bb84ed-397e-435c-8d1b-8ce543108698.csv — Average ridership by route and month.
numpy dependency Runtime dependency required for this page's pipeline or analysis code. Open-source Python ecosystem maintainers. Version pinned by project environment until dependency updates are applied. Library updates may change behavior or defaults.
polars dependency Runtime dependency required for this page's pipeline or analysis code. Open-source Python ecosystem maintainers. Version pinned by project environment until dependency updates are applied. Library updates may change behavior or defaults.
scipy dependency Runtime dependency required for this page's pipeline or analysis code. Open-source Python ecosystem maintainers. Version pinned by project environment until dependency updates are applied. Library updates may change behavior or defaults.